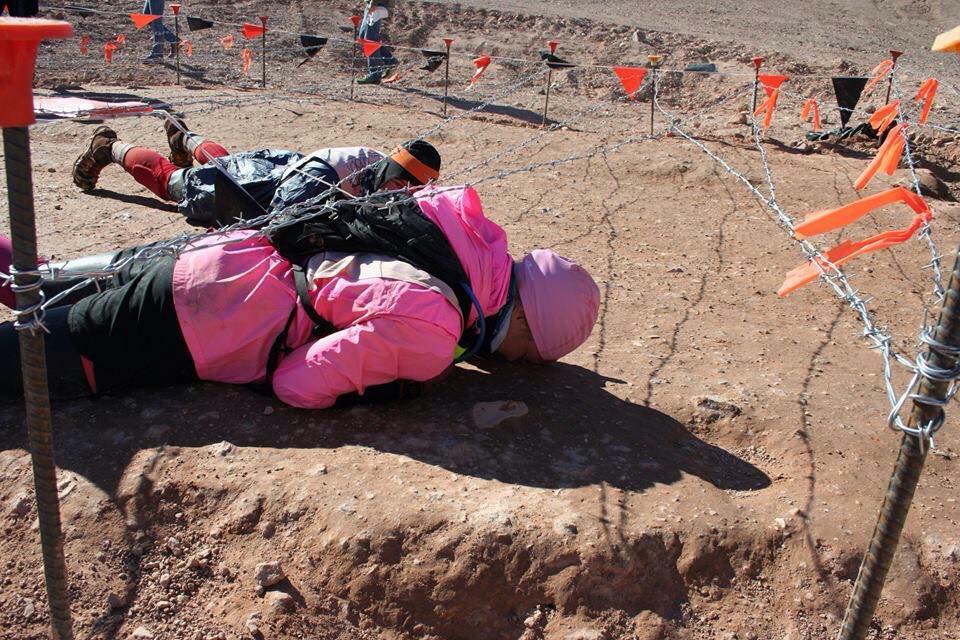
Melissa “Sharkbait” Dugan hits the wall at WTM.
If you missed last week’s article Five Ways Toughest Mudder is effecting World’s Toughest Mudder, give it a quick read. The first four points are listed in that article. This fifth point, Inflated Expectations, ended up being so long I broke it apart into a second article because I didn’t want to gloss over it. With that, enjoy the conclusion of the article and hold on tight, some people may get some feelings hurt but you’ll thank me in the end.
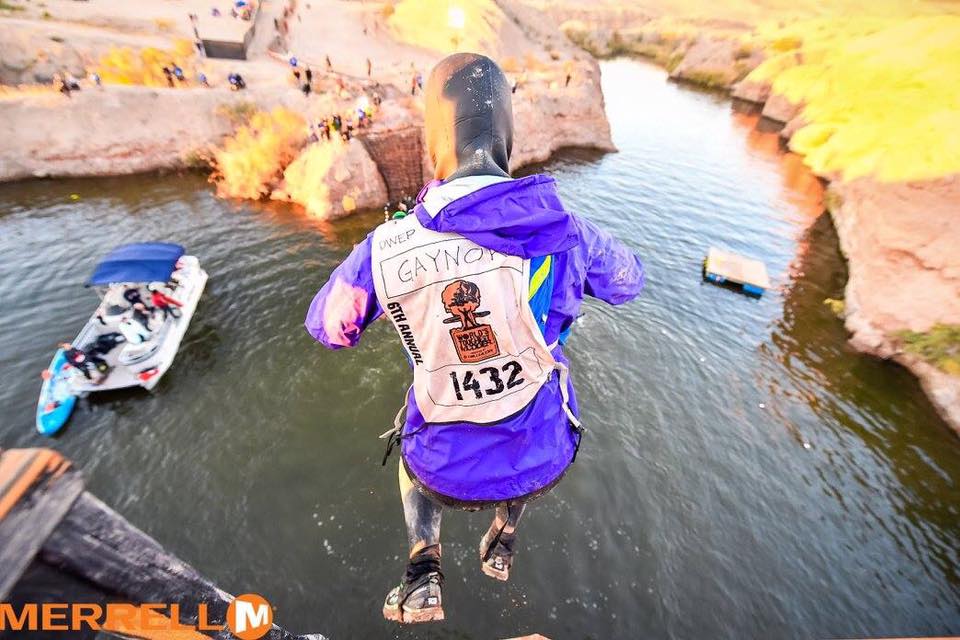
Jen Gaynor Greenfield jumps off The Cliff at Lake Las Vegas.
5. Inflated Expectations:
The logic looks like this, if I can run 25 miles at Toughest Mudder which is 8 hours, I should be able to run 75 miles at WTM which is 24 hours. Unfortunately, you are wrong. For those new to WTM, you will find that the pace slows dramatically in those other 16 hours. Plus there are a ton of other variables including but not limited to, weather, sleep deprivation, overall fatigue, mental strength, obstacle density, obstacle frequency and internal motivation. In an 8 hour event for 25 miles you had to do each obstacle around 4 times, to hit 75 you will have to do each obstacle around 14 times (the obstacle-free hour means you skip each obstacle at least once). The difference in grip and back strength is tremendous and could lead to much longer penalties.
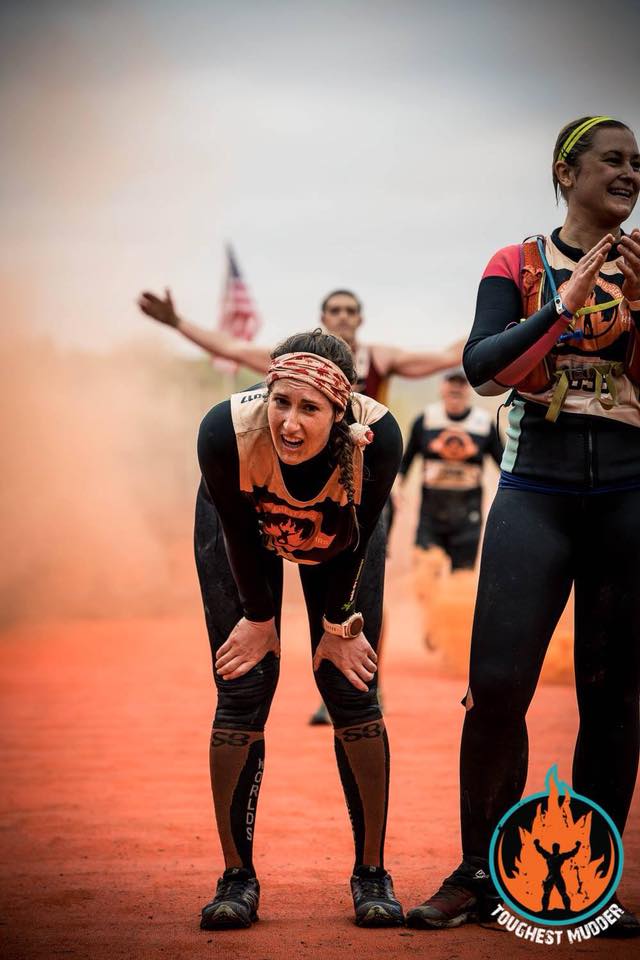
Maxine Brown crosses the finish at Toughest Mudder South (Atlanta).
A better train of logic is if I can hit mileage X in eight hours, I should expect mileage 2X in 24 hours. How does this logic stack up? Pretty good from the elite through the experienced all the way down to newer athletes. Ryan Atkins Toughest/WTM Personal Records (PR) are 50 miles/105 miles, mine is 45 miles/90 miles, Melissa “Sharkbait” Dugan is 25 miles/50 miles and Adriane Alvord 35miles/70 miles just to name a few. Even athletes that have done just one Toughest and one WTM it works pretty well such as Leah Hensley 25 miles/50 miles and Daniel Cramer 25 miles/55 miles. Based on my empirical data and a loose poll taken in the WTM Community that I posted on August 30th, 2017 (if you want to head back and look at the data), the norm is your WTM mileage is twice as high as your toughest mileage. There were a couple of outliers including WTM Veteran Eric Jenkins with a PR of 25 miles and 70 miles but he is not the norm.
<brace for possible hurt feelings>
You may be reading this and saying that doesn’t apply to me because “I got hurt”, “dropped out because it was cold” or <insert other excuses>. While these excuses may be valid or invalid, in the end, it doesn’t matter. When the results link goes up, there is no column for a reason the race ended. No one cares if you could have done another lap or two or five, all that matters is the final number on that results link. When you continually allow for excuses, you will continue to underperform compared to your maximum potential. Additionally, the cold, pain and mental fatigue is all part of racing so the data still transfers because the same decision-making factors that made you quit early on the 8 hr race will make you quit early on the 24 hr race.

Jason Lechner climbs over modified Everest 2.0.
Furthermore, many of these PR mileages were run in 2016 when the weather was unusually warm compared to the previous three years. Add in no windstorm (like there was in 2014) and minimal swimming/crawling obstacles (like there was in 2015 which slow average pace) and athletes could run the course pretty fast leading to higher mileages across the board. Don’t believe me? Look at the number of silver bibs (for 75 miles) earned at the Vegas WTM events for individual performances:
17 in 2014
20 in 2015
62 in 2016
While athletes are getting better, they did not suddenly get three times as good in a single year.
So if you are reading this and feel discouraged, don’t be. What you should be doing, regardless of your skill level is setting tiered goals for WTM and with that, I have managed to ramble on for another full article. Check back on Mud Run Guide next week and I’ll talk about goal setting for World’s Toughest Mudder based on your Toughest Mudder performances.
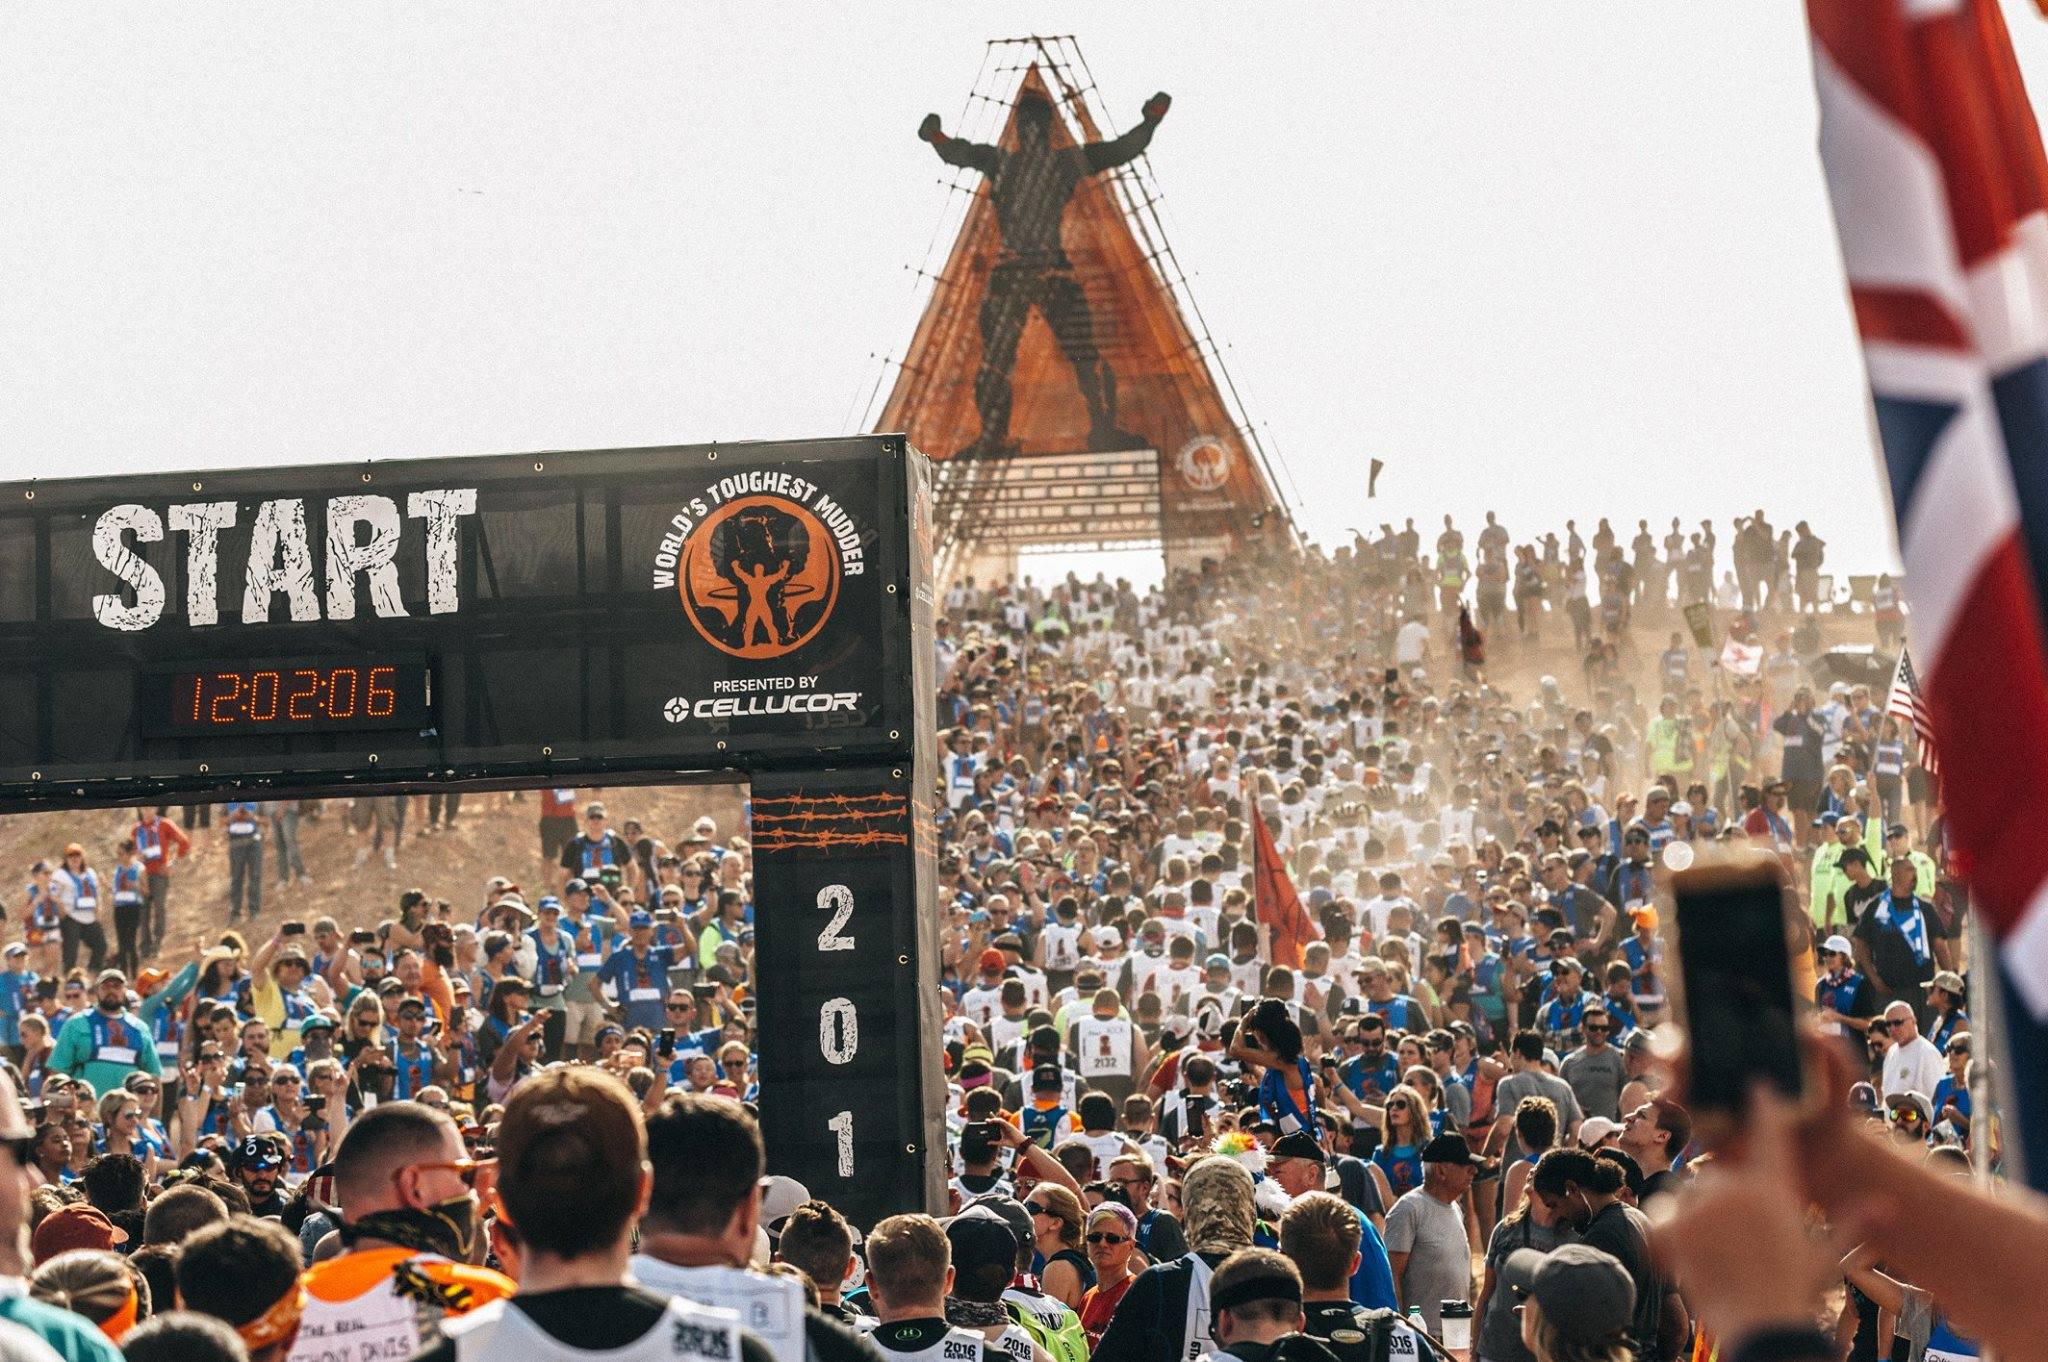
WTM start line.
All pictures provided by members of the World's Toughest Mudder Community on Facebook. Athletes pictures provided the photos when no athlete is listed photo was provided by Kenny Ng.


Great article! Love the idea of setting tiered goals!
Seems like not all Toughest were created equal. If you look at the Whistler data, the formula gets closer to Toughest mileage x 2.5 = WTM mileage goal.