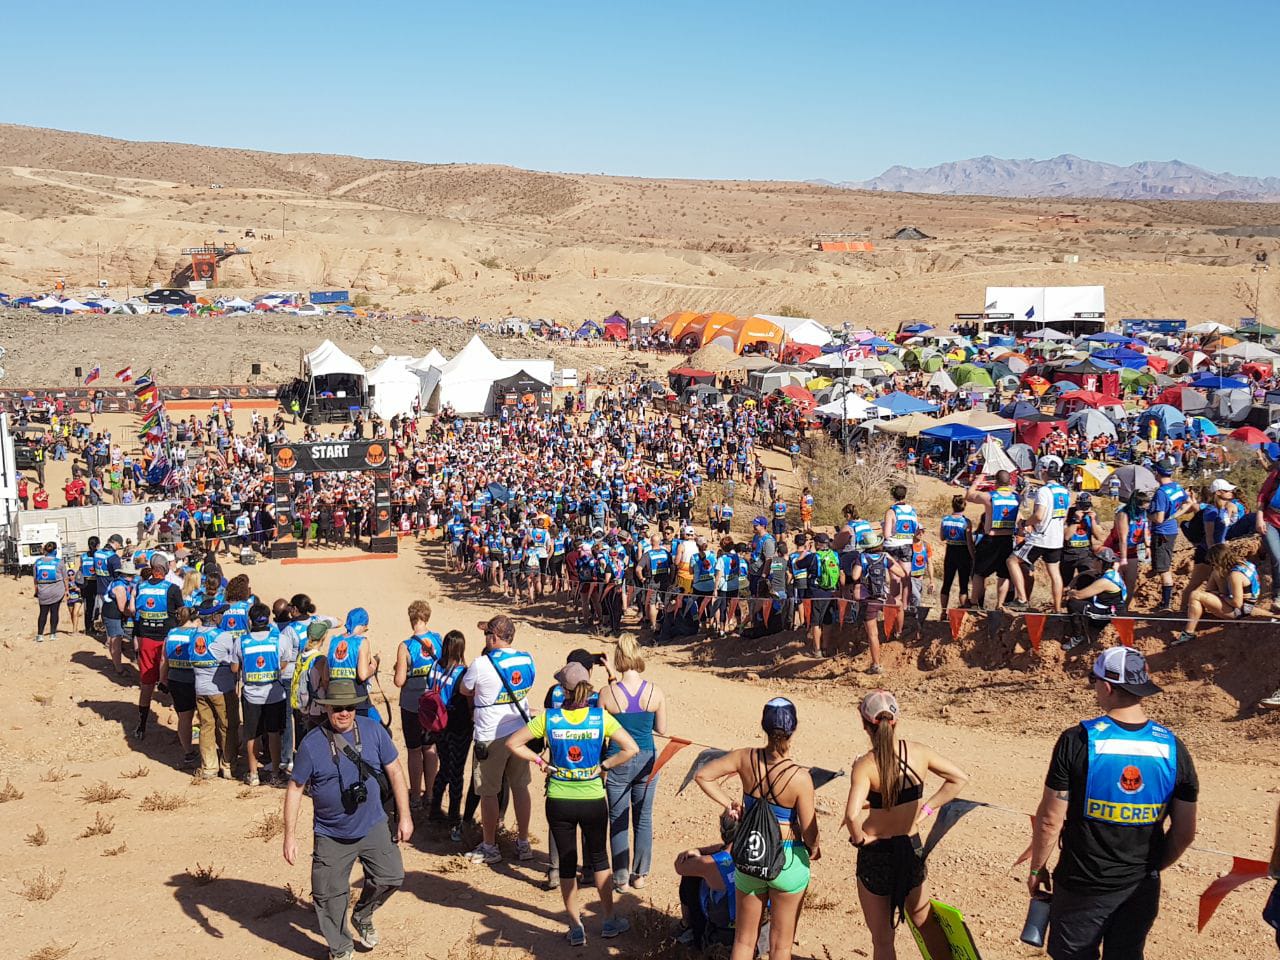
Athletes filtering in to the start line of 2017's World's Toughest Mudder.
For the past three years, I’ve compared the course of the Las Vegas course for World’s Toughest Mudder (WTM). After forgetting to write the article for the last couple of weeks, it finally dawned on me that I had not written one for this year. This was, in fact, the last year in Vegas on the course we know as noted by land adjacent/on previous year's course undergoing construction. Unless we plan on running through vacation housing and hotels, we will most likely never see this specific Cliff or plot of land again at WTM event.
For those that didn’t make it to all four events, here is a quick rundown of how the course compares year to year.
Terrain:
Not a big difference in terrain between the three years since all of them were run over the same ground. 2015, 2106 and 2017 courses were more similar since they had the same start line and headed in the same direction first. 2014’s course started in a different direction heading west up the largest hill first. Elevation gain per lap for the four years is as follows:
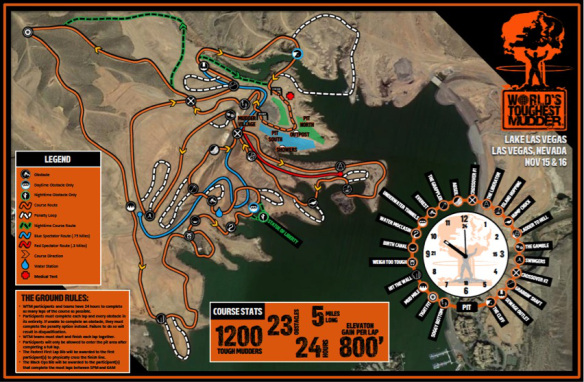
2014 Course Map
2014: 800 feet of elevation gain per lap
2015: 839 feet of elevation gain per lap
2016: 817 feet of elevation gain per lap
2017: 865 feet of elevation gain per lap
Verdict: While some people may view this as a significant difference because it is # of laps time elevation change, I don't view it as having a substantial impact. For the top athletes each year (around 20 laps +/-2) it adds up to 16430, 16780, 16340 and 17,300 feet of elevation gain.
Weather:
I think this is the biggest factor effecting performance. 2014 had the epic sandstorm (the wind gusts up to 30mph) and what I would describe as “cold” weather with temperatures in the mid-40s. 2015 had little wind and but lower temperatures reaching down to 42 degrees. 2016’s temperature bottomed out at 55 degrees, and it reached that temperature slowly. 2017 had temperatures closer to 2016 than any other year and the temperature didn’t drop below 60 degrees until after 10pm and bottomed out in the low 50s. Warmer temperatures means you could run longer (which equates to farther and faster) without a wetsuit. This helps explain the changes in 75-mile silver bibs (17, 20, 62 and 40)between each of the years and 50-mile brown bibs (276, 318, 630 and 657) by individuals. Why did the brown bib go up and the silver bibs go down? I think it is because the rolling opening of obstacles and nicer weather allowed for high mileage early (putting people closer to brown bibs) but the water and rougher course in the evening prevented many from reaching silver.
Personally, I ended up running the first 11 hours without a wetsuit in 2016 and 10 hours in 2017 compared to five hours in 2014 and four hours in 2015 (I did put on my Neptune Performance shirt in 2016/2017 plus used a lightweight neoprene top before I went full wetsuit). My finishes correlate highly to the number of hours without a wetsuit (2016: 90 miles, 2017: 80 miles (2+Team), 2014: 75 miles and 2015: 70 miles).
Verdict: From worst weather to the nicest in order are 2014 (thanks to the sandstorm, reference videos above and below), 2015, 2017 and 2016. 2014 was the only year where mid-race I was wondering if they were going to stop the race because the weather was so bad. In 2014 it also took me three days before I could control my body temperature normally post-WTM (what I think was a product of the wind plus cold), compare that to 2015 which took one day and 2016/2017 which only took a couple of hours. (Slight variations in temperature may be different based on the source you pulled them from, I used Weather Underground…but this gives you an idea.)
Obstacles:
As always Tough Mudder kills it on obstacle innovation by leading the industry. Here are some of the variations by year:
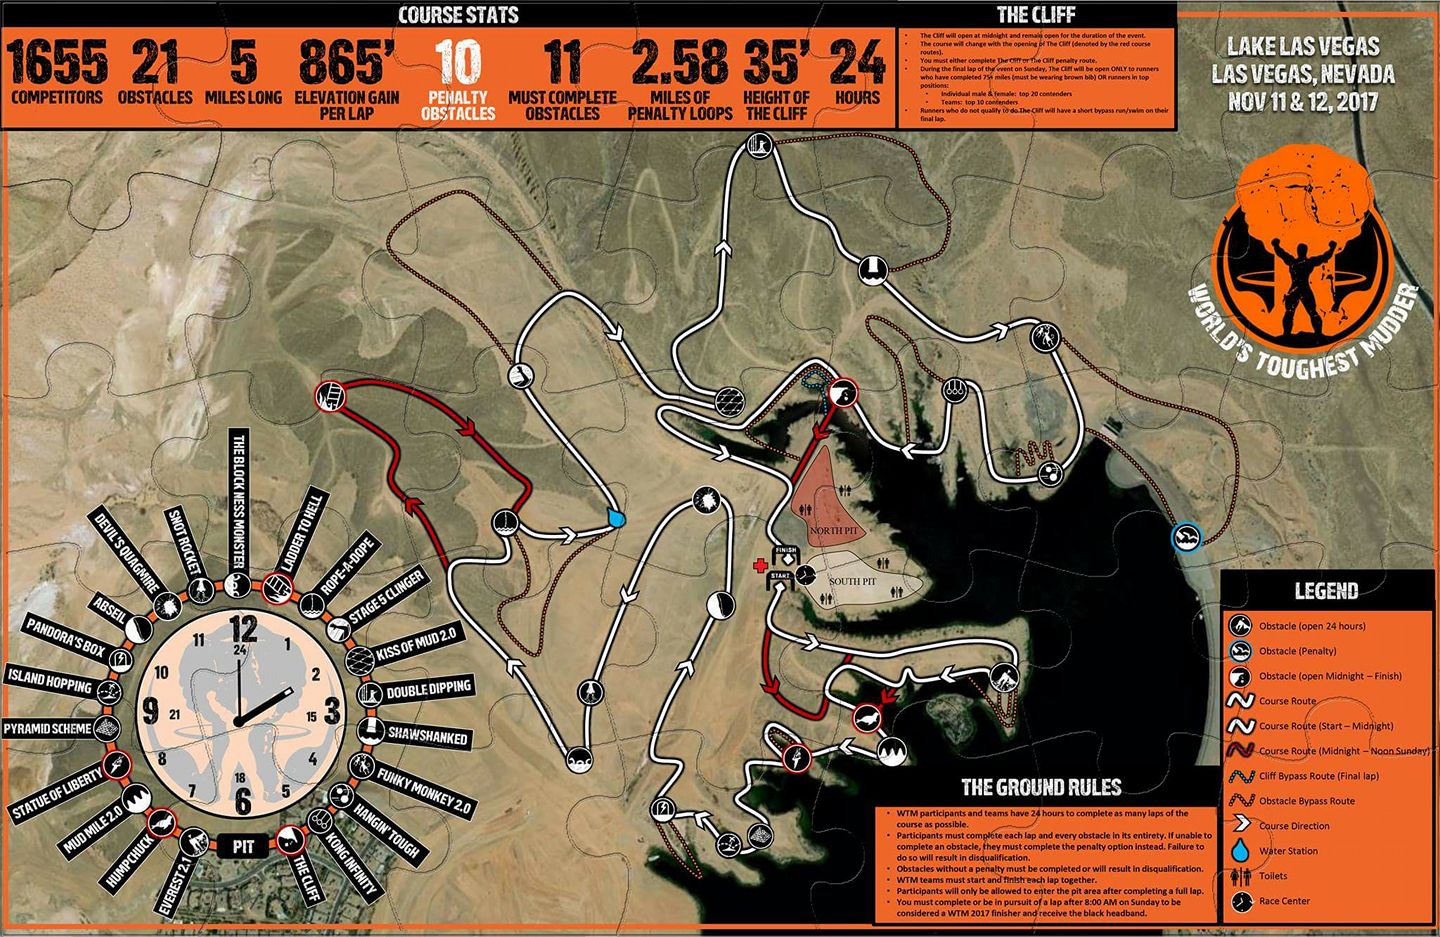
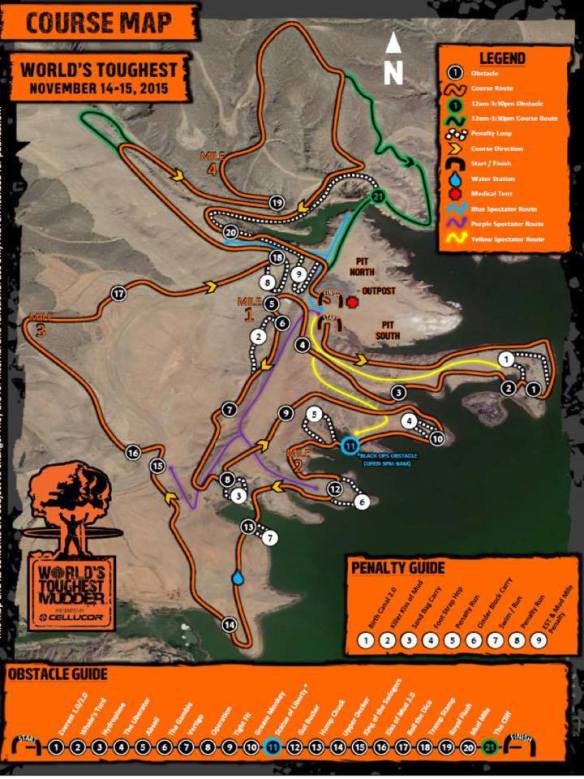
2017's course map.
2014: 13 must complete obstacles and ten penalty obstacles
2015: 12 must complete obstacles, nine penalty obstacles and 1.55 miles of penalty loops
2016: 8 must complete obstacles, 13 penalty obstacles and 2.05 miles of penalty loops
2017: 11 must complete obstacles, 10 penalty obstacles and 2.58 miles of penalty loops
The more penalty obstacles imply harder obstacles because it is impossible to fail things like a low crawl. Based off the data it is clear that 2017 had the most penalty miles and I think if you talk to anyone that was present all four year they would agree that 2017 had the hardest obstacles (see upper body portion).
Everest:
In 2014, only had Everest 1.0. 2015 and 2016 had the same setup with quarter pipe split between Everest 1.0 and Everest 2.0, with a short penalty linked to 1.0. 2017 had Everest 2.0 and 2.1 (a taller version of 1.0).
Verdict: Easiest to hardest: 2014, 2015 and 2016 tied and 2017 was the hardest.
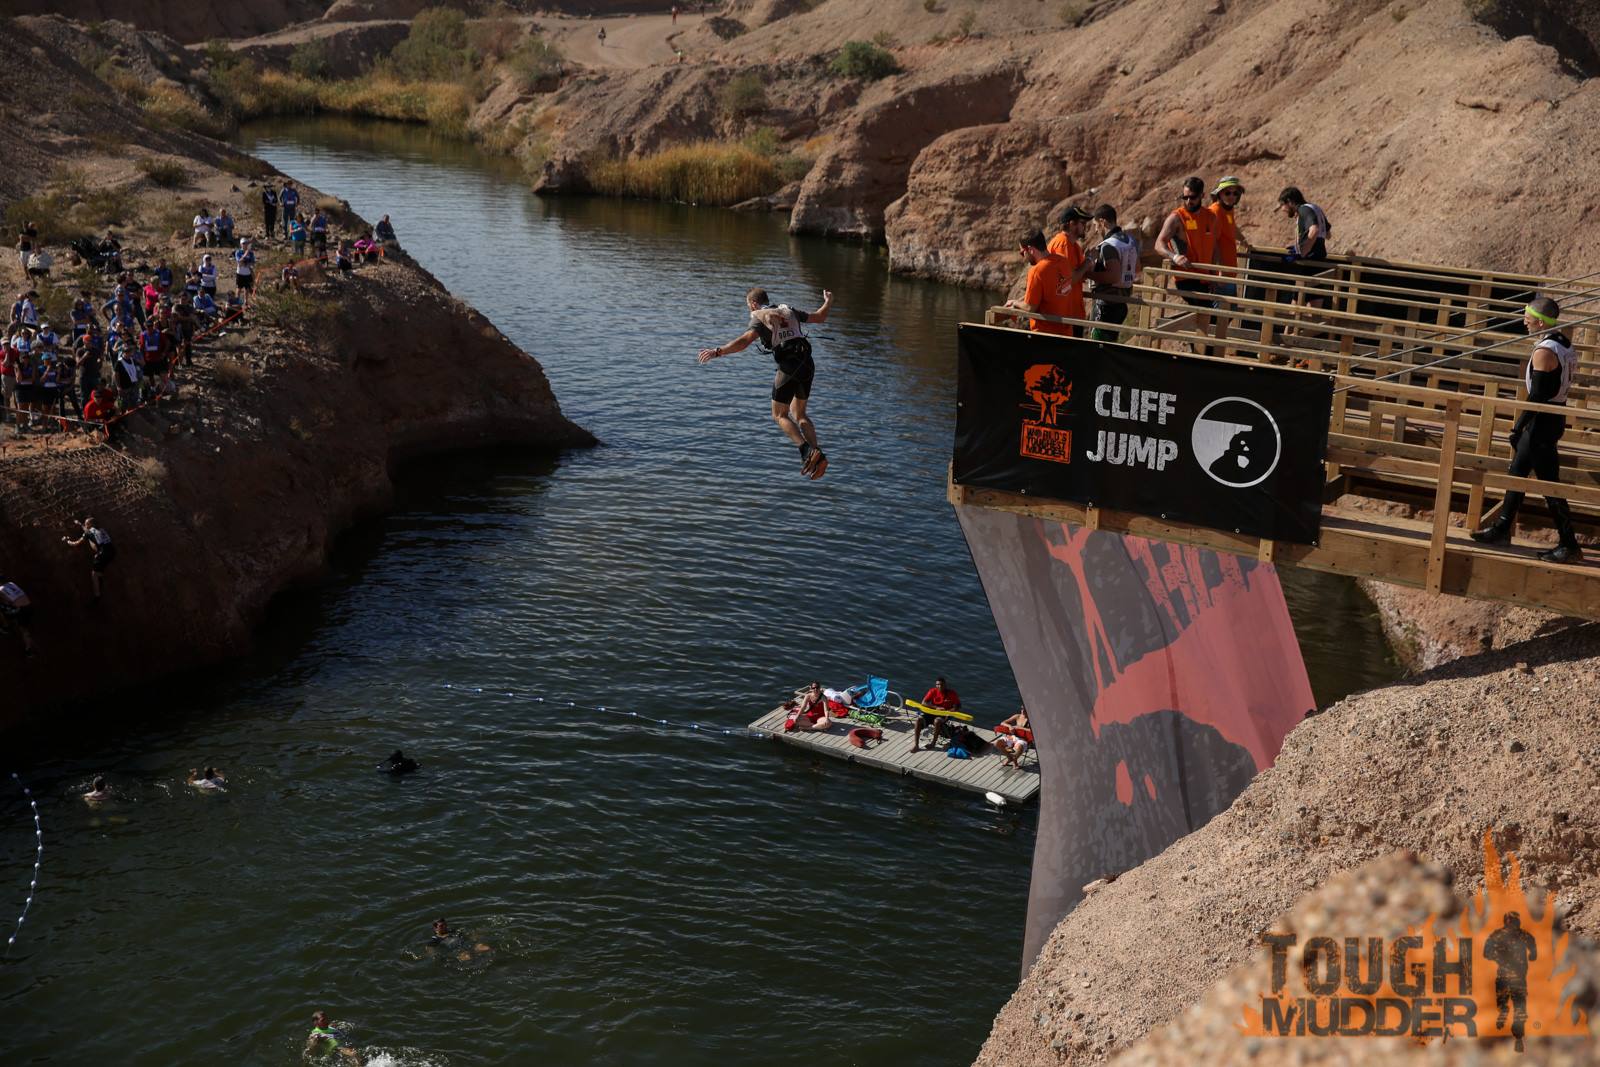
The Cliff:
2014 had The Cliff only open during daylight hours. 2015, 2016 and 2017 The Cliff opened at midnight. Personally, I like the midnight opening because hitting the water from 35 ft. wearing a wetsuit is much more pleasant than hitting the water with bare skin exposed. However, depending on your fears (darkness, exhaustion, heights, unknown, anticipation/pending opening of the cliff) could make one or the other harder.
Verdict: Toss up, although personally, I thought 2014 was the worst of these.
Electricity Obstacle:
In 2014, electricity obstacle was a simple roll of the dice to determine if you were going through Electro-Shock Therapy. In 2015 and 2016, it was Operation (using a pole to retrieve a ring) similar to the game Operation. In 2017, Pandora’s Box (darkened box with live wires hanging down and chains) terrified people pre-event but it turns out the obstacle was quick, kind of easy and easily passable without getting shocked.
Verdict: 2017 was the easiest and usually the quickest. 2014 was the quickest if you got a good roll though, essentially allowing you to just bypass the obstacle. 2015 and 2016 electricity obstacle took longer, eating up time needed to attain mileage but I thought was mentally easier because you controlled if you got electrocuted it wasn’t just a game of chance.
Wall Obstacles:
The three walls of 2014’s Hit the Wall were challenging after a long night of racing. 2015 only had one wall as part of The Gamble, but it was brutal if you had a bad roll of the dice. 2016’s walls were also part of The Gamble but easier than 2015’s walls. 2017 had two walls Double Dipping (one with a rope and one with an overhang).
Verdict: 2014 and 2017 was harder with three mandatory walls per lap and two mandatory walls per lap, respectively. 2015 and 2016 was roll dependent but only required one wall of varying difficulty.
Obstacles that Now Require Teamwork:
Hump Chuck was the same all years except 2017 where they took out the horizontal 2×4 thus requiring this to be a team obstacle instead of an individual obstacle. Pyramid Scheme in 2017 was harder than 2016 due to them removing ropes thus requiring assistance to reach the top.
Verdict: 2017 was harder than 2016. 2014 and 2015 the only ones I recall needing help on was Everest, which was covered above.
Obstacles with Little or No Change:
The Ladder to Hell (aka Giant’s Ladder) was the same although placed in a different location. Abseil was the same (although the knots in 2016/2017 negatively affect my super-fast descending technique I teach in Strength & Speed’s Guide to Elite OCR). Statue of Liberty (crossing a swim with a Tikki torch) was the same all four years. Snot Rocket was basically the same in 2016 and 2017, although in 2017 it felt like the water was being filtered through ice. Block Ness Monster was the same in 2017 and 2016 but was easier than 2015 (which had around four rotating blocks instead of two and was called Roll the Dice in Vegas theme)
Although the swim was significantly shorter in 2016. Liberator was harder in 2016, with only one set of vertical holes versus the double set of holes in 2014 and 2015. However, the addition of the board at the bottom late in the night made it easier so I would view them as the same level of difficulty. Statue of Liberty was the same, although 2016/2017 had longer torches which were easier I don’t recall seeing people fail that one in 2014 or 2015 so it seems like a moot point.
Verdict: Toss up.
Cargo Net:
2014 and 2015 had Tight Fit (loose cargo net over tractor tires), and 2016 had Giant Wedgie (A frame cargo net with cargo net over it). Both took a while, and I personally disliked 2014's Tight Fit the most. 2017 had the Devil's Quagmire, which sucked because it was another water obstacle but was definitely easier than Tight Fit and took less time than Giant Wedgie.
Verdict: Toss up. Do you want a wet obstacle, one that takes a while or one that is super frustrating as you get caught five feet from the end?
Mud Obstacles:
2014 and 2015 both had Mud Mile (mud mounds) with water pits in between, but that was absent in 2016. Instead, 2016 had Kiss of Mud 2.0, which was crawling under barbed wire through the mud. 2017 had Kiss of Mud (or Kiss of Rocks as people have been not so affectionately calling it) plus Mud Mile.
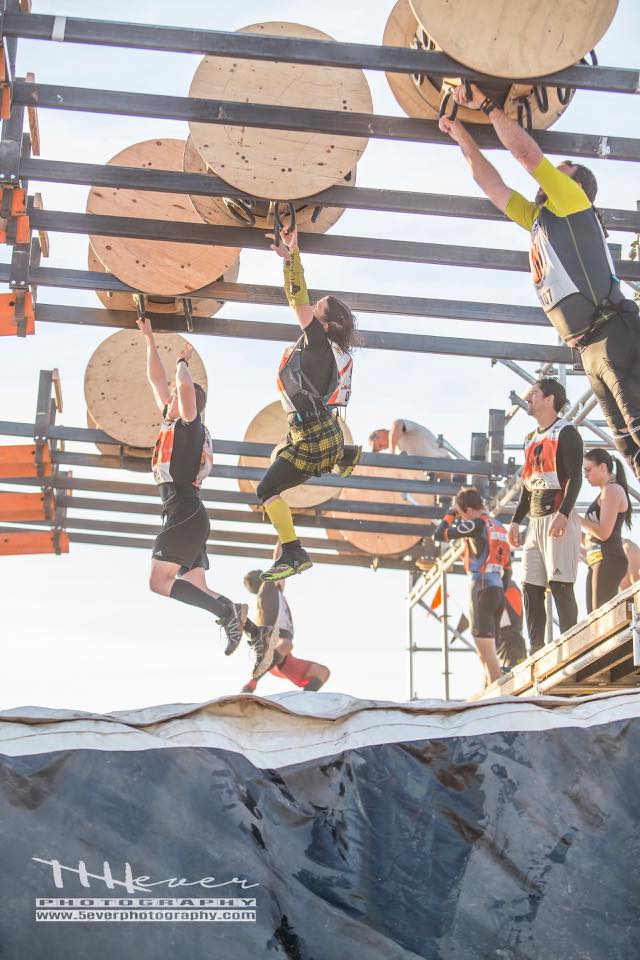
Battle Corps Athlete Leah Hensley on Kong Infinity
Verdict: 2017 was slightly harder with two mud obstacles eating time, but realistically the difference is marginal in the overall length of the race.
The Grappler:
Present in 2014 and 2016, but not present in 2015 or 2017. The easiest was in 2015 when it was not there but right behind that was in 2016, when frequently athletes were allowed to “piggyback” on someone else’s thrown ball thus making it an ascent.
Verdict: Hardest in 2014, then 2016. Not a factor in 2015 or 2017, although their absence was nice for a lot of people preventing a failed obstacle.
Upper Body:
2014 had Funky Monkey 2.0 as the highlight of their upper body obstacles, which involved monkey bars then swinging to a pipe traverse. 2015 was slightly easier with monkey bars to a downhill drainage pipe. 2016 set the stage challenging upper body more than years before with Funky Monkey Revolution, Stage 5 Clinger and Kong (rings for 1/3 of the event and pipe traverse for the other 2/3). 2017 took things up another level putting Stage 5 Clinger and Rope A Dope (rope climb/Tyrolean traverse) halfway through the lap then right after a water obstacle (Shawshanked) putting all three upper body/grip obstacles (Funky Monkey Revolution, Hang Time and Kong Infinity)
Verdict: 2017 had the hardest upper body by far, 2016 comes in 2nd followed by 2014 and 2015 in a tie. As OCR should be, if you were good at the obstacles it allowed for a pretty fast course (reference 2016 record mileage by the field and 2017 record mileage by overall winners), so while some other liked 2014/2015's obstacles, I personally loved 2017 the most.
Strength & Speed Athlete Jordan Smith emerging from King of Swingers on his way to a top 15 finish at WTM 2015.
Missing Obstacles:
2014 had two obstacles (Crossover) that were just crawling through a pipe. There was nothing like this in 2015 or 2016. The majority of the obstacles required some degree of strength. The Gut Buster was present only in 2015, which personally I thought was one of their hardest obstacles ever (especially for short people). 2014-2016 had King of Swinger or a variant (Double Rainbow), which was noticeably absent from 2017.
Verdict: Most difficult obstacles in 2017, then 2016, 2015 and finally 2014.
2015 Course Map
The Water:
I don’t recall the exact temperature of any of the years of WTM. However, based off memory (which is notoriously unreliable), I felt 2015 had the coldest water and 2014 was the warmest with 2016/2017 in the middle. While I don’t think the temperature of the water effected performance that much, I do think the quantity of water effect performance. 2015 had a lot of water spread out throughout the course compared to 2016 and 2014. However, they all pale in comparison to 2017 which felt like every obstacle was a water obstacle and if you failed some obstacles it became even worse.
Verdict: In my opinion 2014 and 2017 are a tie. 2014 was hardest because high winds compounded the effect of being wet but 2017 had much more water obstacles so you were wet more often and for longer. 2015 was in the middle and 2016 was easiest due to less swimming along with not as frequent wet obstacles.
The X Factor:
The X factor is anything other variables not captured in the above topics. First is variations in start times, 2014 had a 10 am, 2015 had a 2 pm and 2016/2017 had a noon start time. The more time you spend in daylight, the easier it will be due to a lack of wetsuit, less clothing and the ability to see without relying on a headlamp. This, makes the earlier start times “easier.” A noon or earlier start time I also think is mentally easier. In 2015 when the sun came up there was still 8 hours left as compared to 4 hrs (2014) or 6 hrs (2016/2017). This meant a lot of racing was still left despite a rising sun which could be mentally draining.
Second is fear of the unknown. 2014 presented a course/terrain no one had ever seen before leveling the field. By 2017, many of the athletes felt “at home” on the course having spent up to 72 hours on that patch of land prior to starting the race.
Third is YOU or more specifically your strengths and weaknesses. For some harder obstacles might play to a personal strength and for others weakness. For some bad weather plays to strengths because they will not quit regardless of the temperatures.
Fourth, 2014 had an obstacle free lap, 2015/2016 had an obstacle free hour and 2017 had a rolling obstacle opening starting at an hour and ending almost four hours later. That meant more running and fewer obstacles up front for 2017. It also meant when all the obstacles opened they felt harder because you had run longer.
Verdict: The X factor of YOU determines what was easiest/hardest based on your strengths and weaknesses and your mental state.
Final Verdict:
So which year was the hardest and which was the easiest? As always it depends on your strengths and weaknesses. 2014 was the hardest due to weather (windstorm plus colder temperatures). 2017 was the hardest obstacles of the four years and had the most amount of times getting wet. 2014 also had a large fear of the unknown for everyone because of the new location, which we will see again in 2018 in Atlanta.
While record mileages were achieved in 2016 (for the field) and in 2017 (for the winners- Ryan Atkins110 new record, Rea Kobl 90 tying Amelia Boone from 2012). 2016 implies it was the easiest with a record number of silver bibs, more than any other year (and more than some years combined), but 2017 had a record number of brown bibs. Although, more people received brown bibs in 2017 than any other year despite most claiming “it was the hardest WTM course ever in Vegas”. Maybe it was the hardest and people are getting better or maybe it is the most recent painful memory so it feels that way.
Finally, I'll say course length is always a published five miles. That being said in 2015 many people were reporting over 5 miles per lap even when penalty free. 2014 and 2016 most people I know clocked it at exactly five miles. 2017 day time laps were five miles and the night time lap removed some running but it felt like it added a lot more. Tough Mudder Headquarters always claims five miles though.
Verdict: I wouldn’t call this (or any other 24-hour race) easy; it is more like 2016’s WTM allowed for faster laps if you were obstacle proficient with a strong upper body and was amplified due to nice weather. 2017 was actually very similar if you were obstacle proficient but with more obstacle that required you to get wet. As always there is variation in the course, weather and obstacles from year to year. Plus there are variations in you the athlete, sometimes you are better trained than other years, sometimes your accumulated stress or life experiences effect how you perform on that given day. The bottom line is it doesn't matter which was the hardest year because that is largely determined by your strengths and weaknesses and is mostly subjective. If you earned your bib in the perceived easiest or hardest year it doesn't matter because you still earned it. The course may change but the standard doesn't.
Hope you enjoyed this comparison and I'll see you in Atlanta for 2018.
All pictures are from Tough Mudder unless otherwise noted via watermark. Start line picture from Getting Tough Facebook page.
Disclaimer: The viewpoints expressed by the authors do not necessarily reflect the opinions, viewpoints and official policies of Mud Run Guide LLC, or their staff. The comments posted on this Website are solely the opinions of the posters.


What a great article! I like how you’ve covered this years event & the past three. For someone who knows absolute nothing about the Worlds Toughest Mudder & what its all about. You’ve done a great job explaining many fine details. Keep up the great work!