I feel like people are now expecting me to do a comparison every year since I started writing this post-race comparison article after 2016’s World’s Toughest Mudder (WTM) (here’s the one from last year comparing all four years of WTM Vegas: Leaving Las Vegas). With WTM at a new location for the first time in half a decade, the inevitable question is which venue is harder and how do they compare. So let’s cut to the point and get started. To make the comparison easier I broke it apart into topics: terrain, weather, obstacles, water, and X factor.
Terrain:
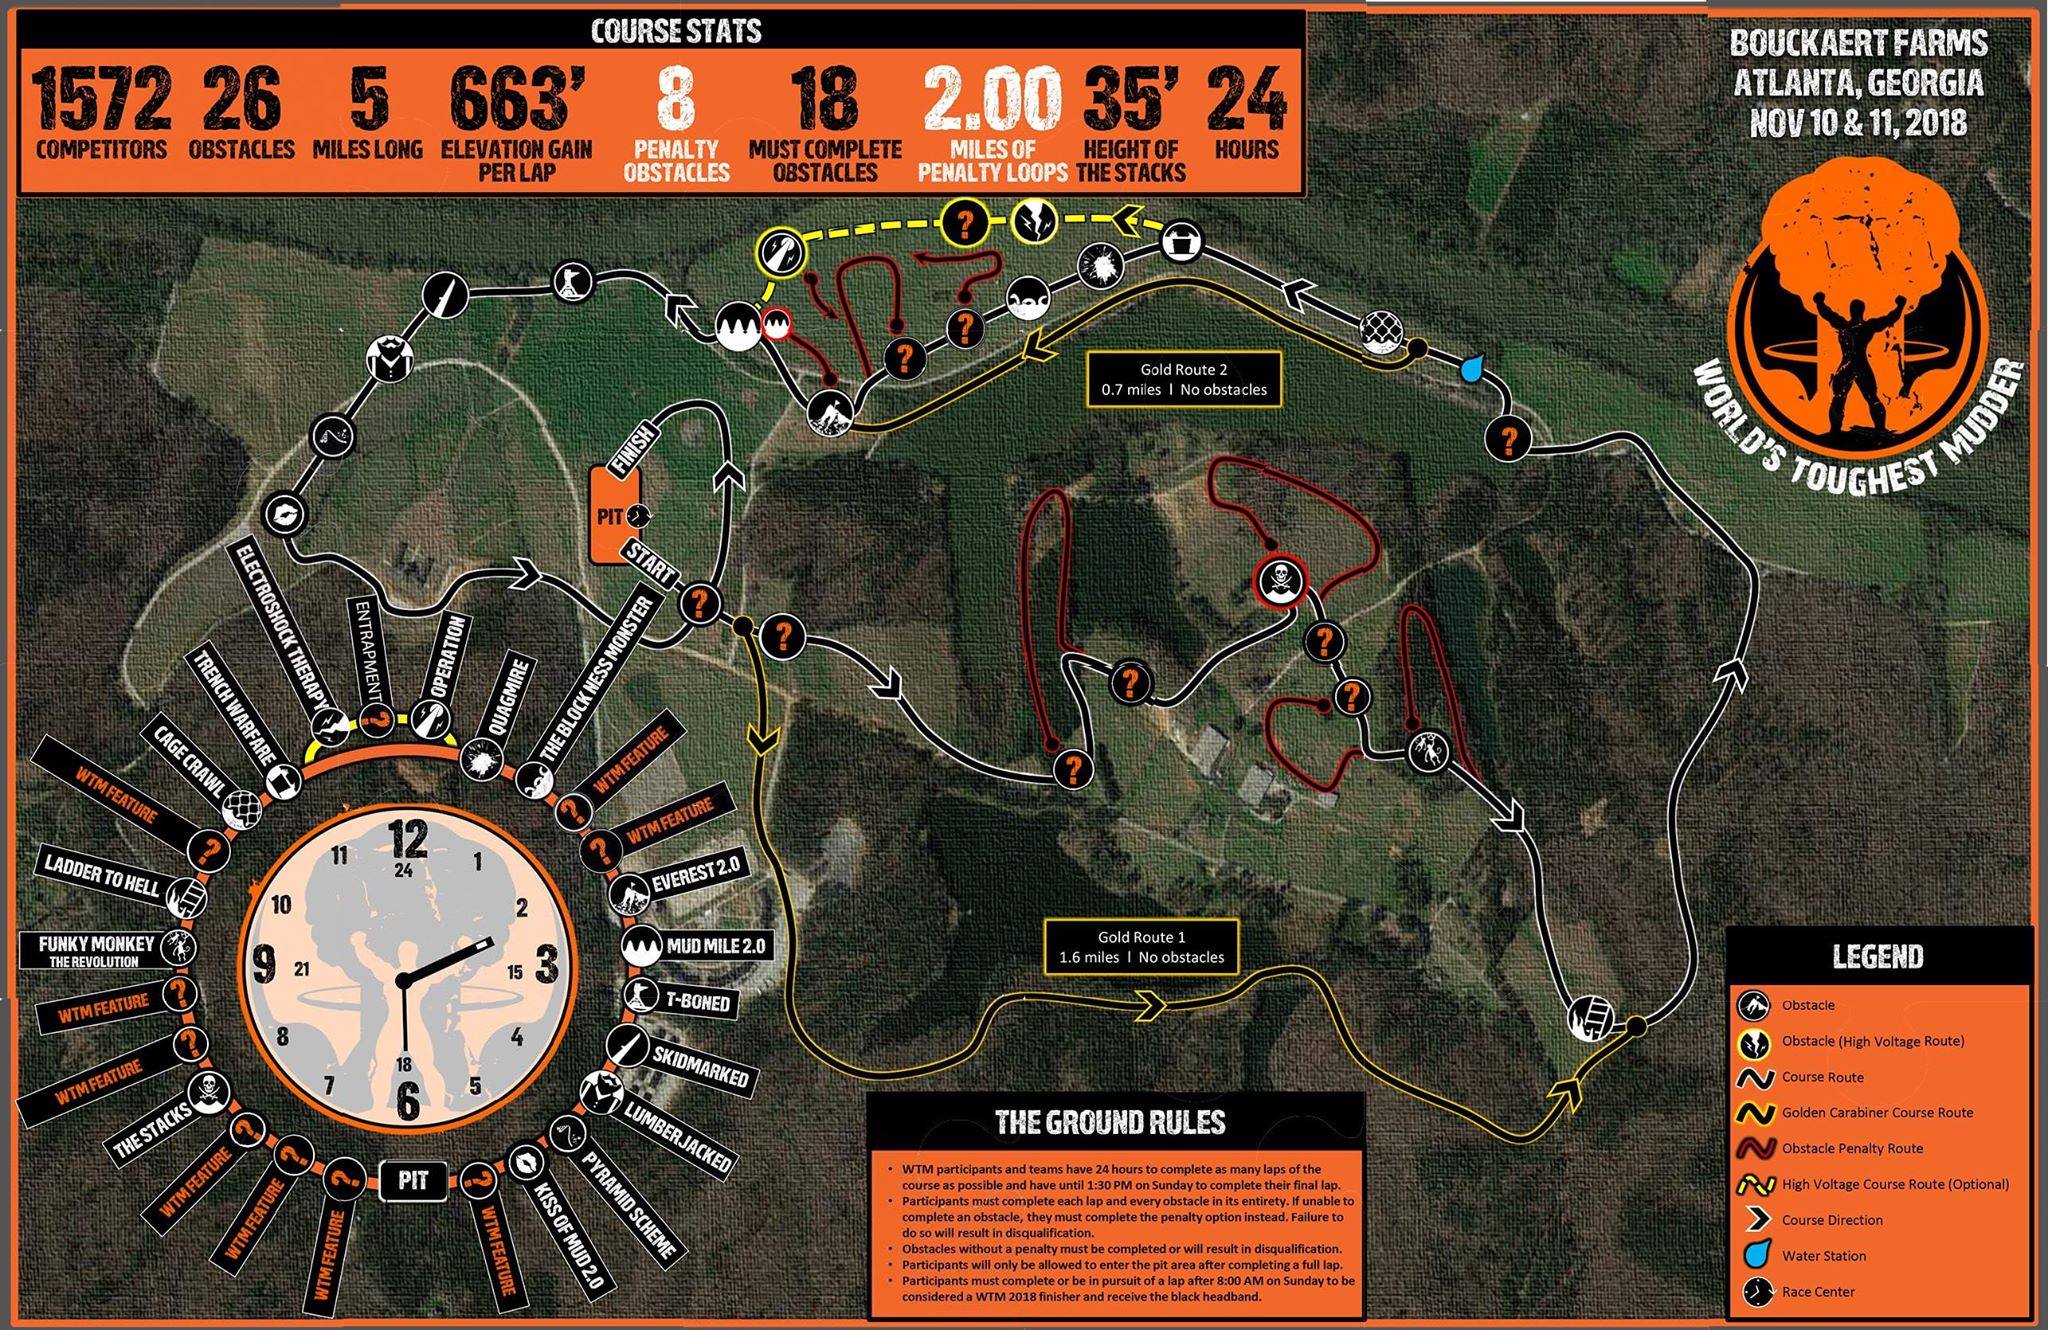
The terrain in Las Vegas was nice with hard packed dirt that was almost like running on roads or improved trails. In fact, I wore road shoes for several of the years I ran the venue without traction issues. Atlanta was muddy and more technical terrain. While not as muddy as I was expecting to have a nice pair of trail/Obstacle Course Racing (OCR) shoes is recommended (I rocked Merrell’s All Out Crush 2 for 24 hours). The average elevation of the Vegas course was 830 feet per lap, significantly more than the 663 feet per lap of Atlanta. While that may not seem that big of a difference if you run 50 miles, that’s nearly an extra 2000 feet of climbing over the course of the race.
Verdict: Las Vegas had more elevation gain but easier dirt to run on. It also felt like Vegas’ uphill sections and downhills were longer and steeper. With less elevation, the Atlanta course seems easier on paper, but the technicality and mud of the course make it a draw. Overall, I assess it as neutral.
Weather:
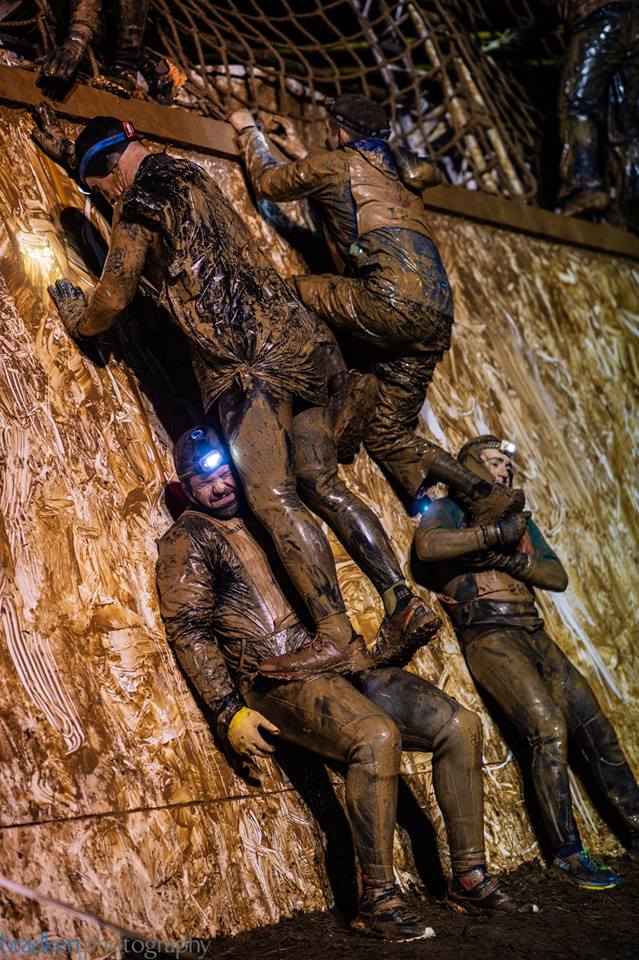
The weather changes every year. When Tough Mudder Headquarters (TMHQ) announced they were going to Atlanta, people screamed “HOTLANTA” and I even saw a couple of the infamous #nowetsuitsneeded hashtags come back. However, if you looked at the weather, you would have seen Atlanta is historically colder on WTM weekend than it was in Vegas. Vegas highs were usually in the 70s during the day and dropped to mid-40s or 50’s (year dependent). Atlanta, by contrast, started at 43 degrees (went up to 48 before sunset) then plummeted down to below 32 degrees (as evidence by obstacles freezing). Colder weather means more neoprene, which means more restricted movement and carrying more weight.
Verdict: It’s easy to look at the low and give it to Atlanta, but there is something to be said about contrast. When your body is used to running in 70-degree weather and the temperature drops 30 degrees it’s a shock to your system. Atlanta had about a 12-degree difference from starting temp to lows (18 if you go high temps to low temps). This contrast can make the temperature feel worse than it actually is. Still, the cold of Atlanta was worse, no doubt. As I type this (7 days post event) my fingertips are still numb. Atlanta was definitely harder but at least there was no windstorm like there was in 2014.
Obstacles:
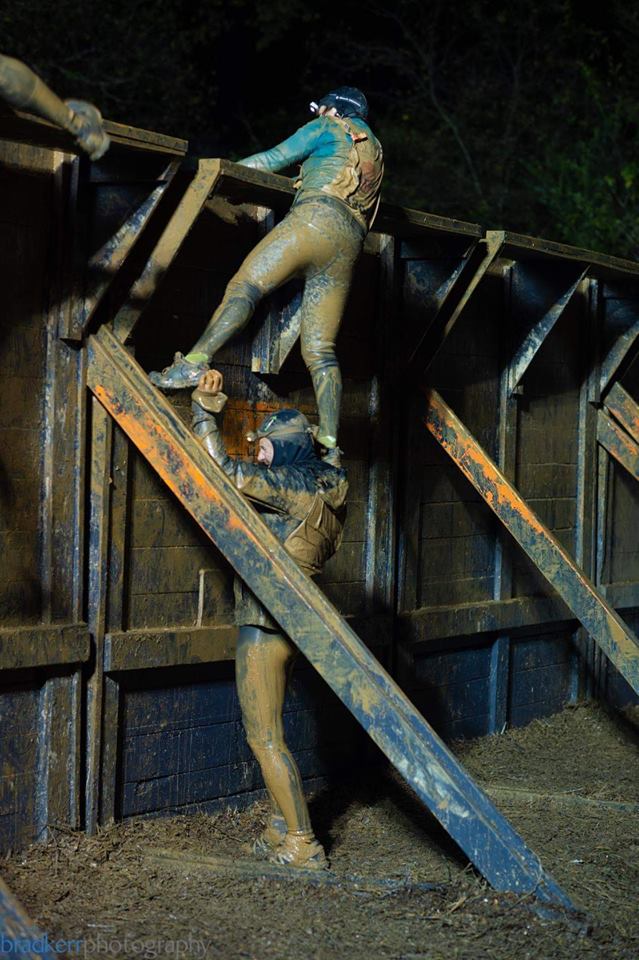
Las Vegas averaged around 21 obstacles per lap. On paper, Atlanta said 26, but three of those were on the electricity route, so realistically it is about the same. However, things like Lumberjacked (horizontal logs elevated awkwardly high off the ground) were like six (or eight?) obstacles in one. Las Vegas averaged 11 must complete obstacles, while Atlanta had 18. Must complete typically implies you can’t fail them, which means they are probably easier.
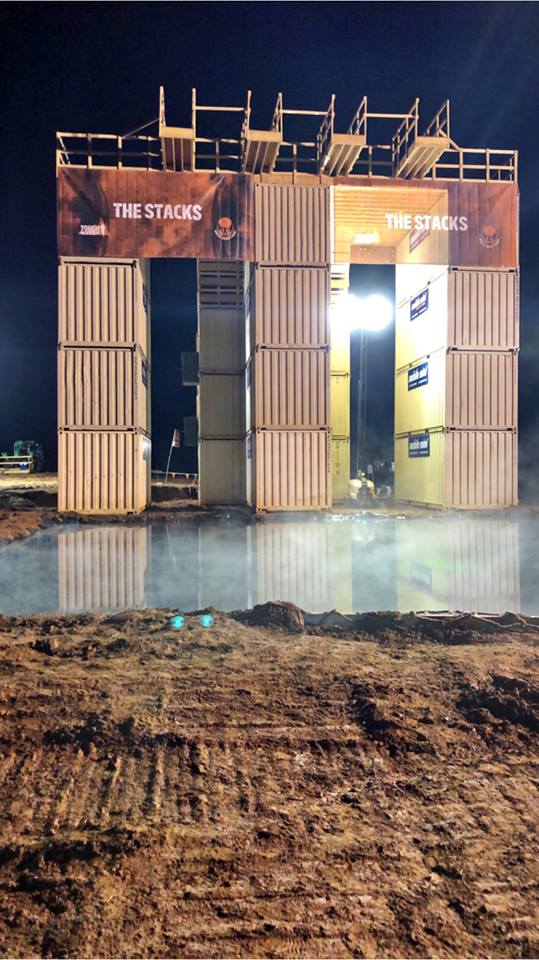
Everest was the normal 2.0 option (similar to 2015) without an option for Everest 1.0 (no curved lip) or 2.1 (taller with no curved lip). The Cliff (now The Stacks) was basically the same except you now had to climb up, which was much easier than it looked. So that’s really a non-issue.
Most of the event obstacles are a toss-up taking slightly longer or shorter than previous versions. The only comment I will make is that there was definitely less upper body/grip obstacles, specifically if you took the electricity route. After 8 pm (when electricity opened), I only had to do one upper body/grip obstacle per lap (Funky Monkey 2.0 Revolution). Compare that to the hardest year of upper body/grip obstacles, 2017, when there were four grip obstacles per lap (Funky Monkey, Kong Infinity, Hanging Tough and Rope a Dope). However, the one grip obstacle is comparable to 2014/2015.
Verdict: So many obstacle variables here that it is hard to say. Some took more time and some took less time so it’s a draw in a lot of categories/comparisons. I’m going to go with my gut instinct though and how I felt personally. Atlanta’s obstacles were on par with 2014-2016’s WTM but definitely easier than 2017’s in the upper body/grip category.
Water:
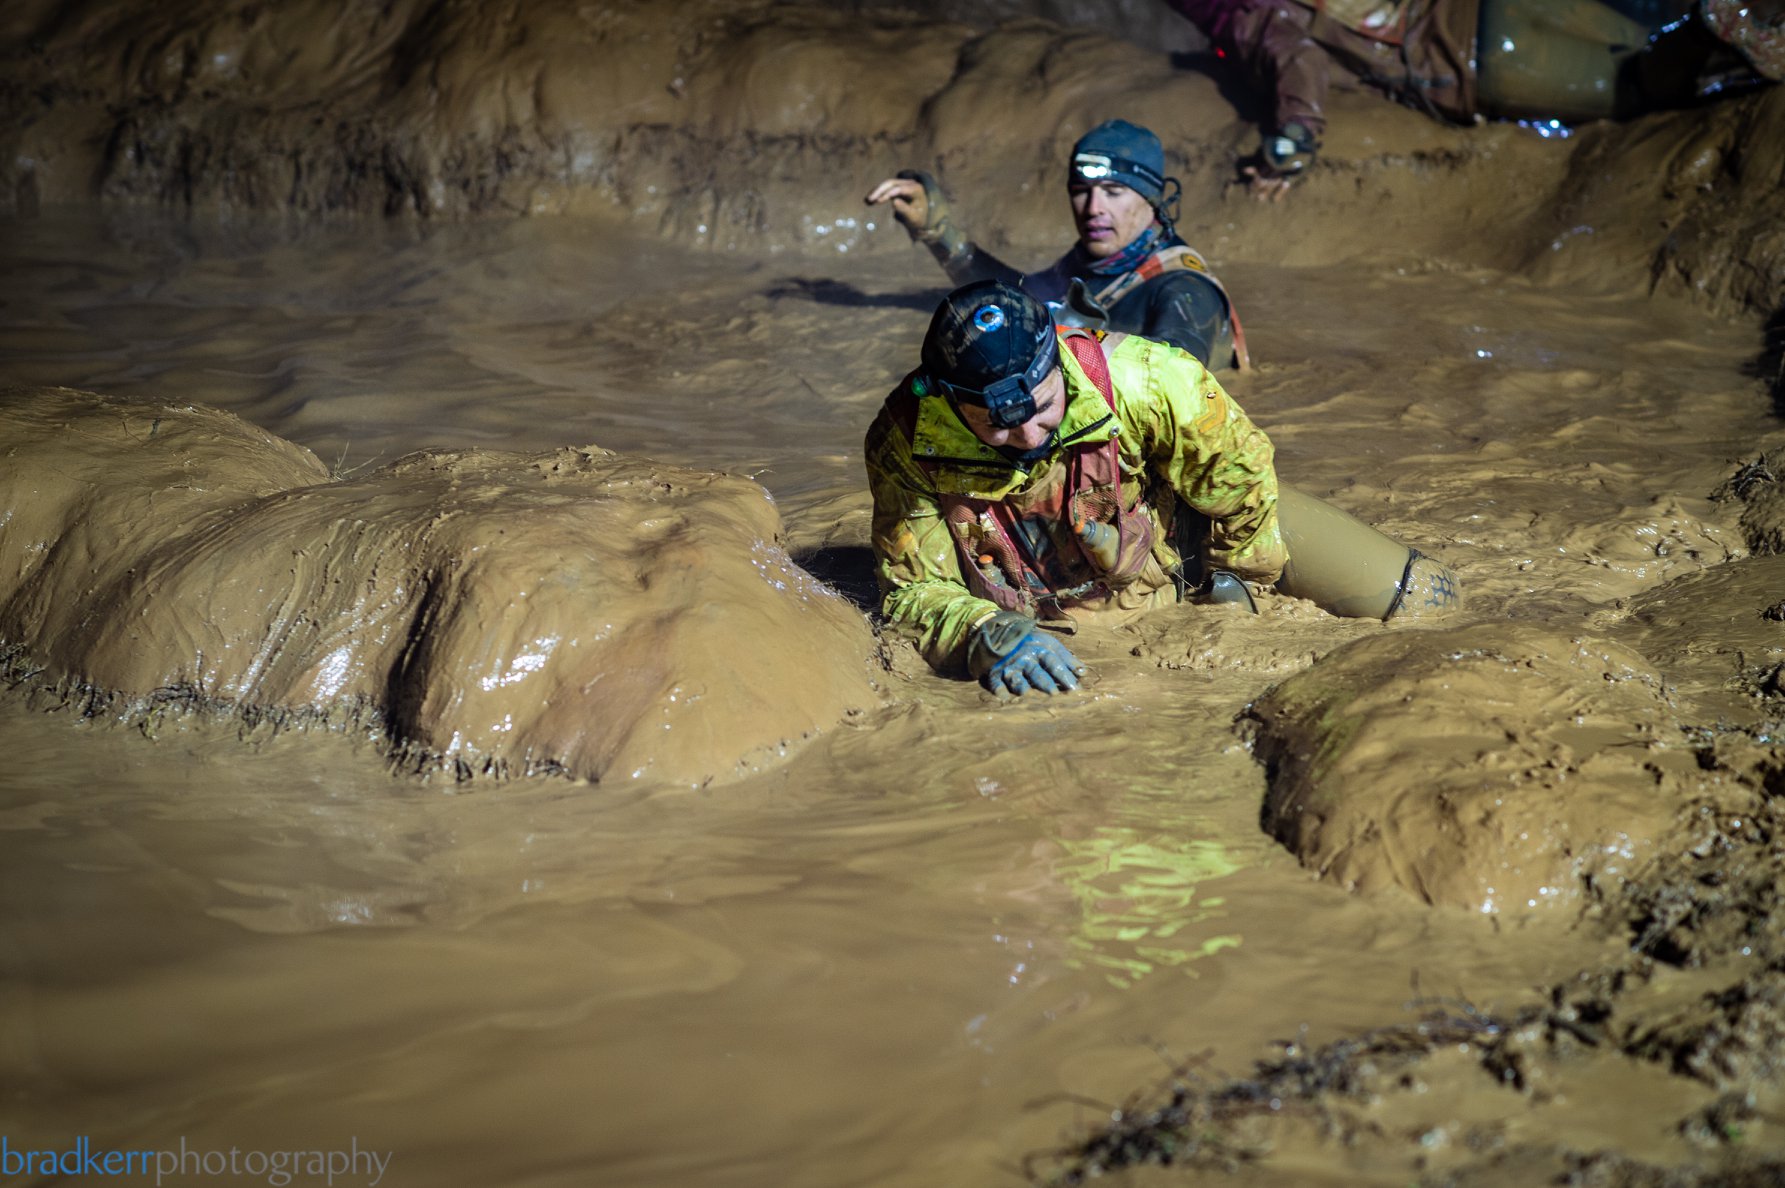
Atlanta had the potential to be worse with 11 obstacles that you could get wet (that is if you failed almost all of them and took the obstacle route over the electricity route). Due to extreme cold temperatures, I’m pretty sure I saw volunteers quitting, TMHQ did shut down several of the water obstacles reducing the number of times you got wet and limiting full submersion (Underwater Tunnels (basically a swim under floating barrels) closed and they turned off the spouts on Augustus Gloop (a climb up a wall with water pouring down)).
Verdict: It’s a toss-up again. Viewed in isolation there was not as much water on the course of Atlanta (due to obstacle closures and electricity route). However, the colder temperatures made getting wet feel much worse.
X-Factor:
This encompasses all of the other variables that weren’t already covered. The new location means new challenges and fear of the unknown. I could see the nerves higher on even experienced racers coming into this event. Previously the X factor included things like start time (Vegas had a 10 am start in 2014, 2 pm in 2015, and noon the final two years), which is now a non-issue since noon seems to be the new standard.
Also includes things like obstacle opening (2014 had an obstacle-free lap, 2015/2016 obstacle free hour and 2017 rolling obstacle opening after an hour). The rolling opening after an hour of 2017 and 2018 are definitely easier than both other options (and allow for a smoother race with fewer lines at obstacles early in the event).
Add in things like the Golden Carabiner and the Electricity Route option and I think Atlanta was easier due to a reduction in upper body obstacles across the board.
The biggest X-factor though is you. Your personal strengths and weaknesses play a large role here. Maybe you’re better at the upper body, maybe you’re scared of electricity and maybe you love the cold. Each person’s hard and biggest challenge might be slightly different.
Verdict: Toss up again.
Overall:
If all of these things were weighted equally, it would be a tossup between Atlanta and Las Vegas. However, for most people, they will hit muscle failure at some point in their upper body and end up doing lots of penalties. So essentially the race turns into a death march (scroll through the middle of the night Facebook videos). While all of these factors affect the outcome, I think the weather is what people remember most (nope, still can’t feel my fingertips). That being said, while I personally found parts of the course easier than the Vegas courses, the cold made this a truly challenging experience.
The finisher mileages were on par with 2014’s WTM and historically lower than 2015-2017. If there is any indication, that is it. Despite athletes improving due to training, knowledge (as provided in my book Mud Run Guide’s Ultra-OCR Bible) and experience, mileages returned to 2014 standards. I said it after the event, “I haven’t been this impressed with the WTM Community ever”. Those that braved the cold all night you should feel proud that was quite an accomplishment regardless of your mileage. For those that pushed themselves to a breaking point, hold your head up, you can’t get better if you don’t push to failure at some point. Looking forward to another chilly year in Hotlanta in 2019.
Watermarked pictures from Brad Kerr Photography
All others pulled from the WTM Community Facebook group



Leave A Comment