The 2015 OCR World Championships is fast approaching, and a flurry of discussions has come up regarding obstacle difficulty, and how hard a course should be. In the lead-up, ABF Mud Run is bringing a modified version of their “The Destroyer” obstacle, “Dragon's Back” is making it's way overseas courtesy of Toughest, and last year's dreaded obstacle Platinum Rig is returning with 2 separate rigs. Not to mention whatever tricks course designer Garfield Griffiths has up his sleeve. With this background in mind, we thought it would be good to take a look back at 2014, and analyze some of the results as we prepare for the next round.
As a reminder, the course was held at King's Domain, the course known for hosting Mud, Guts, and Glory, and some participants already had some familiarity with the course and obstacles. However, the course was extended from the usual 5 miles to be a full 8.5 miles with nearly 3,500 feet of climbing and 60 obstacles. Kevin Jones of the Crazy Mudder Muckers combined a GPS track with a list of obstacles to create this map seen to the right.
With such a variety of obstacles, some proved to be more difficult than others. The Platinum Rig decimated the field across all age groups and divisions. Some, such as the Rope Climb, were simple, yet still provided a challenge. We have taken the data from the official results from the OCRWC, and provided some stats and analysis of a few key obstacles. Some shortcuts to different parts of our analysis are below:
Table of Contents
Overview of Results & Times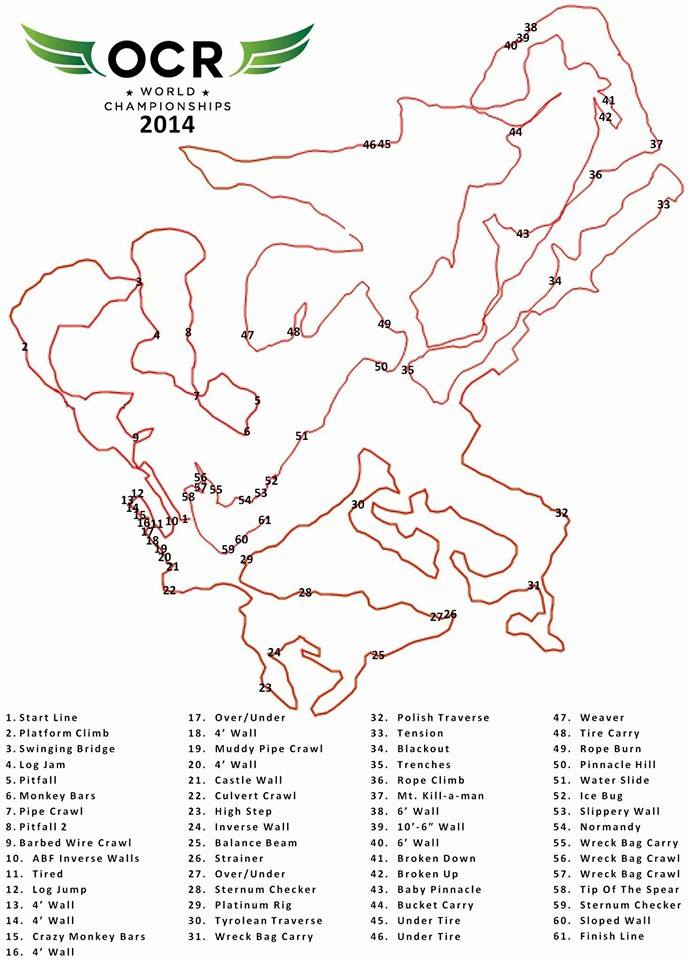
Participation by Country
Participation by US State
Overall Obstacle Completion Rate
Obstacle Failure Count by Obstacle
Number of Obstacle Failures Per Athlete
Platinum Rig Analysis
Ring My Bell Analysis
Tip of the Spear Analysis
Weaver Analysis
Monkey Business Analysis
Random Facts
Conclusion
*Note – Our data analysis below is only as good as our source data. A few updates might have been made to the results since we ran our analysis. We also were unable to determine the country for 6 athletes, or the US state for 3 athletes.
Overview of Results & Times
According to the official results, the first OCRWC had 573 competitors. Consisting of 154 females, and 419 males. To see the regular results & times, you can find them right here
Our analysis looks at failure & completion rate and does not look at times. Kevin Jones of Crazy Mudder Muckers pulled together some data and broke down the overall pass/DQ rate by division, as well as fastest, slowest, and average times. He made a handy chart – click it to view the full sized data.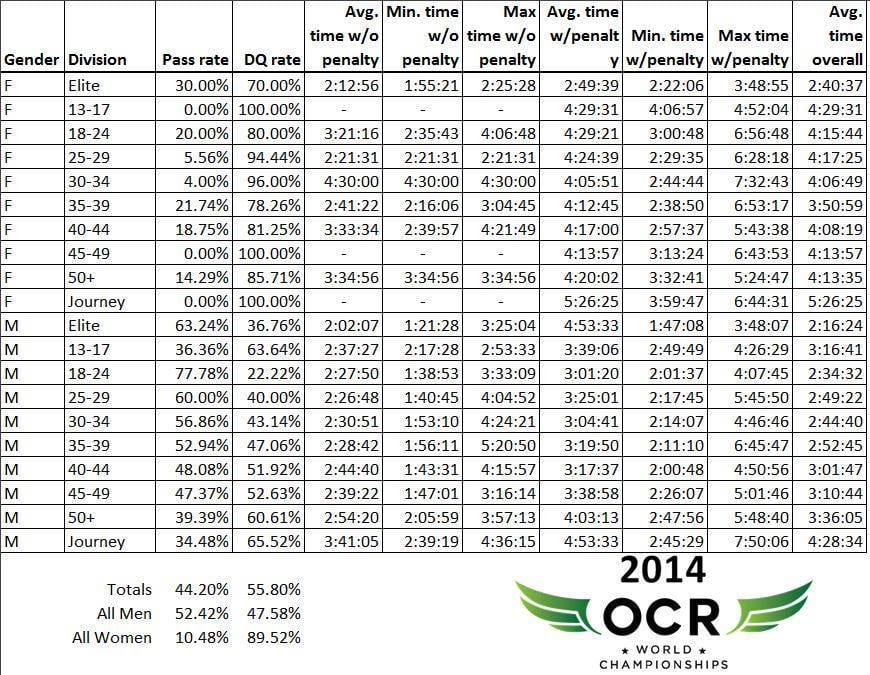
2014 OCRWC Participation by Country
 As expected, since the race was held in Ohio, over 80% of the competitors hailed from the US. However, strong contingents made the trip from Canada, The United Kingdom, The Netherlands, Sweden, Australia, and South Africa.
As more international races are added as qualifiers, and as those international athletes return home to spread the word, we will likely see an increase in international competitors in future years. At the time of publication, there are athletes from 17 different countries registered for 2015 already.
| Country | # of Athletes | % of Athletes Competing |
|---|---|---|
| United States | 459 | 80.10% |
| Canada | 28 | 4.89% |
| United Kingdom | 22 | 3.84% |
| The Netherlands | 17 | 2.97% |
| Sweden | 17 | 2.97% |
| Australia | 11 | 1.92% |
| South Africa | 7 | 1.22% |
| Unknown | 6 | 1.05% |
| Belgium | 3 | 0.52% |
| Germany | 2 | 0.35% |
| Mexico | 1 | 0.17% |
Virtual Teams by Country
The OCRWC held a separate team race on Sunday. However, let's take a moment to consider how each country ranked against each other, if the top finishers from each country were combined into a team. This factors in the top-finishing placers from each country, on Saturday (the individual race) for those who successfully completed the race with no penalities of any sort.
Men's Country Team Rankings
| Country | Male Team of 4 | Male Team of 2 |
|---|---|---|
| United States | 1:30:32 | 1:26:38 |
| Canada | 1:36:48 | 1:27:12 |
| United Kingdom | 1:37:30 | 1:26:59 |
| Sweden | 1:39:18 | 1:32:45 |
| South Africa | 1:46:16 | 1:35:32 |
| The Netherlands | 2:12:31 | 2:06:30 |
The only change for the males when going from 4 person team to 2 person team was Canada & UK swapping podium positions.
Women's Country Team Rankings
| Country | Female Teams of 2 |
|---|---|
| Sweden | 2:05:44 |
| United States | 2:06:22 |
| South Africa | 2:14:39 |
| Canada | 2:22:39 |
Due to the number of finishers, women's rankings are only available for teams of 2, not 4
Co-Ed Country Team Rankings
| Country | 4 person Team (2 male, 2 female) | 2 Person Team (1 male, 1 female) |
|---|---|---|
| United States | 1:46:30 | 1:44:58 |
| Sweden | 1:49:14 | 1:40:59 |
| Canada | 1:54:55 | 1:52:36 |
| South Africa | 1:55:06 | 1:52:34 |
Changing the co-ed team size from teams of 4 to teams of 2 gave Sweden the winning time, and South Africa went from fourth to third place by a mere 2 seconds.
2014 OCRWC Participation by US State
There's no denying that distance makes a difference, as Ohioans were the most heavily represented states in the USA. With the event being held at King's Domain again in 2015, expect this to be the same next year.
| State | # of Athletes | % of Athletes Competing |
|---|---|---|
| Ohio | 109 | 23.75% |
| Pennsylvania | 36 | 7.84% |
| New York | 28 | 6.10% |
| Massachusetts | 24 | 5.23% |
| New Jersey | 20 | 4.36% |
| Arizona | 20 | 4.36% |
| Florida | 19 | 4.14% |
| Indiana | 19 | 4.14% |
| California | 17 | 3.70% |
| Virginia | 16 | 3.49% |
| Georgia | 16 | 3.49% |
| Kentucky | 13 | 2.83% |
| Michigan | 13 | 2.83% |
| Texas | 10 | 2.18% |
| Illinois | 10 | 2.18% |
| North Carolina | 9 | 1.96% |
| Wisconsin | 9 | 1.96% |
| Colorado | 8 | 1.74% |
| Missouri | 6 | 1.31% |
| South Carolina | 5 | 1.09% |
| Maryland | 4 | 0.87% |
| Louisiana | 4 | 0.87% |
| West Virginia | 4 | 0.87% |
| New Hampshire | 4 | 0.87% |
| Montana | 4 | 0.87% |
| Connecticut | 4 | 0.87% |
| Vermont | 4 | 0.87% |
| Oregon | 4 | 0.87% |
| Unknown | 4 | 0.87% |
| Tennessee | 3 | 0.65% |
| Utah | 2 | 0.44% |
| Maine | 2 | 0.44% |
| Washington | 2 | 0.44% |
| New Mexico | 1 | 0.22% |
| Arkansas | 1 | 0.22% |
| Mississippi | 1 | 0.22% |
| APO | 1 | 0.22% |
| Iowa | 1 | 0.22% |
| Nebraska | 1 | 0.22% |
| Deleware | 1 | 0.22% |
2014 OCRWC Overall Obstacle Completion Rate
The OCRWC has a mandatory obstacle completion rule. To be eligible for prize money and podium spots, athletes had to successfully complete every obstacle. They were allowed to retry as many times as desired, however, upon failure, they had their wrist-band taken, were assessed a penalty (4 minutes for every obstacle except the weaver, which was 8 minutes), and were placed in a separate set of results. Being the World Championships, no-one expected all competitors to complete every obstacle. However, I'm not sure people expected a failure rate quite this high.
Only 251 competitors completed the course with no penalties, meaning only 43.80% of the athletes were able to successfully complete the course. Breaking it down by gender changes the story. Only 21 of the 154 females completed the course. Of the males, 230 of the 419 males completed the course.
Obstacle Completion Rate by Division
This table dives into more and more granularity. It starts with overall stats, then male vs. female, and then elite v age group vs. journeyman, and then breaking those down by gender
| Division | Failure-Free Racer Count | % of Racers Penalty Free | Racers who had at least one obstacle failure count | % of Racers who Failed at least one obstacle |
|---|---|---|---|---|
| Overall | 251 | 43.80% | 322 | 56.20% |
| Male | 230 | 54.89% | 189 | 45.11% |
| Female | 21 | 13.64% | 133 | 86.36% |
| Elite | 53 | 54.08% | 45 | 45.92% |
| Age-Groupers | 188 | 43.12% | 248 | 56.88% |
| Journeyman | 10 | 25.64% | 29 | 75.35% |
| Male Elite | 44 | 64.71% | 24 | 35.29% |
| Female Elite | 9 | 30% | 21 | 60% |
| Male Age-Grouper | 176 | 54.66% | 146 | 45.34% |
| Female Age-Grouper | 12 | 10.53% | 102 | 89.47% |
| Male Journeyman | 10 | 34.48% | 19 | 65.52% |
| Female Journeyman | 0 | 0% | 10 | 100% |
Obstacle Completion Rate by Age-Group Category
This dives into each age group category, after the overview from above.
| Division | Failure-Free Racer Count | % of Racers Penalty Free | Racers who had at least 1 obstacle failure count | % of Racers who Failed at least 1 obstacle |
|---|---|---|---|---|
| M13-17 | 4 | 36.36% | 7 | 63.64% |
| F13-17 | 0 | 0% | 2 | 100% |
| M18-24 | 28 | 77.78% | 8 | 22.22% |
| F18-24 | 2 | 20% | 8 | 80% |
| M25-29 | 30 | 60% | 20 | 40% |
| F25-29 | 1 | 5.56% | 17 | 94.44% |
| M30-34 | 29 | 56.86% | 22 | 43.14% |
| F30-34 | 1 | 4% | 24 | 96% |
| M35-39 | 27 | 52.94% | 24 | 47.06% |
| F35-39 | 5 | 21.74% | 18 | 78.26% |
| M40-44 | 27 | 51.92% | 25 | 48.08% |
| F40-44 | 3 | 18.75% | 13 | 81.25% |
| M45-49 | 18 | 47.37% | 20 | 52.63% |
| F45-59 | 0 | 0% | 13 | 100% |
| M50+ | 13 | 39.39% | 20 | 60.61% |
| F50+ | 0 | 0% | 7 | 100% |
2014 OCRWC Obstacle Failure Count by Obstacle
If you asked any racer or spectator who was in Ohio for the OCRWC, they would likely tell you that the Platinum Rig was the most difficult obstacle. According to the data, it was: 44.50% of the participants failed on the Platinum Rig. However, it's doubtful they would have named Ring My Bell (a knotless rope climb) as the second most failed obstacle. Below is the count of failures at each obstacle. Keep in mind that an athlete could fail more than one obstacle (or none at all). The following sections will provide an analysis of some of the most failed obstacles.
Overall Failure by Obstacle
| Obstacle | # of athletes who failed | % of athletes who failed |
|---|---|---|
| Platinum Rig | 255 | 44.50% |
| Ring My Bell | 166 | 28.97% |
| Tip of the Spear | 151 | 26.35% |
| Weaver | 112 | 19.55% |
| Tyrolean Traverse | 73 | 12.74% |
| Monkey Business | 64 | 11.17% |
| Polish Traverse | 45 | 7.85% |
| Vertical Wall | 26 | 4.54% |
| Monkey Bars | 18 | 3.14% |
| Normandy | 14 | 2.44% |
| Bucket Carry | 13 | 2.27% |
| Inverted Wall 2 | 13 | 2.27% |
| Sternum Checker 1 | 8 | 1.40% |
| Sternum Checker 2 | 7 | 1.22% |
| Inverted Wall 3 | 7 | 1.22% |
| Tire Carry | 7 | 1.22% |
| Castle Wall | 5 | 0.87% |
| Balance Beam | 3 | 0.52% |
| Tire Crawl | 1 | 0.17% |
| Heavy Feet | 1 | 0.17% |
| Inverted Wall 1 | 1 | 0.17% |
| Tootsie Roll | 1 | 0.17% |
2014 OCRWC Number of Obstacle Failures Per Athlete
So we know that Platinum Rig took out nearly half the field. If that obstacle had not been there, would we have seen 90%+ obstacle completion? Unfortunately not. The following table looks at various breakdowns of division and country, to look at how many athletes failed 1, 2, 3, 4, or 5 or more obstacles during the course of their run.
Number of Obstacle Failures Per Athlete, By Country
This table looks at the number of failures per athlete, broken down by country
| Country | # of Athletes Penalty-Free | # Failed Single Obstacle | # Failed Two Obstacles | # Failed Three Obstacles | # Failed Four Obstacles | # Failed Five+ Obstacles |
|---|---|---|---|---|---|---|
| Unknown | 4 | 0 | 0 | 0 | 1 | 1 |
| Australia | 7 | 1 | 1 | 0 | 2 | 0 |
| Belgium | 1 | 0 | 0 | 0 | 1 | 1 |
| Canada | 13 | 5 | 3 | 4 | 0 | 3 |
| Germany | 0 | 1 | 0 | 0 | 0 | 1 |
| Mexico | 0 | 0 | 1 | 0 | 0 | 0 |
| South Africa | 7 | 0 | 0 | 0 | 0 | 0 |
| Sweden | 10 | 5 | 1 | 0 | 1 | 0 |
| The Netherlands | 8 | 2 | 3 | 2 | 1 | 1 |
| United Kingdom | 7 | 3 | 2 | 4 | 1 | 5 |
| United States | 194 | 80 | 45 | 54 | 40 | 46 |
Number of Obstacle Failures Per Athlete, By Division
This table dives into more and more granularity. It starts with overall stats, and then male vs. female, then elite vs. age group vs. journeyman, and then and breaking those down by gender
| Category | # of Athletes Penalty-Free | # Failed Single Obstacle | # Failed Two Obstacles | # Failed Three Obstacles | # Failed Four Obstacles | # Failed Five+ Obstacles |
|---|---|---|---|---|---|---|
| Overall | 251 | 97 | 56 | 64 | 47 | 58 |
| Male | 230 | 68 | 34 | 33 | 29 | 24 |
| Female | 21 | 29 | 22 | 31 | 18 | 33 |
| Elite | 53 | 21 | 13 | 8 | 2 | 1 |
| Age-Groupers | 188 | 71 | 39 | 51 | 42 | 45 |
| Journeyman | 10 | 5 | 4 | 5 | 3 | 12 |
| Male Elite | 44 | 12 | 7 | 3 | 2 | 0 |
| Female Elite | 9 | 9 | 6 | 5 | 0 | 1 |
| Male Age-Grouper | 176 | 54 | 24 | 25 | 25 | 18 |
| Female Age-Grouper | 12 | 17 | 15 | 26 | 17 | 27 |
| Male Journeyman | 10 | 2 | 3 | 5 | 2 | 7 |
| Female Journeyman | 0 | 3 | 1 | 0 | 1 | 5 |
Number of Obstacle Failures Per Athlete, By Age Group Category
This dives into each age group category, after the overview from above.
| Age Group Division | # of Athletes Penalty-Free | # Failed Single Obstacle | # Failed Two Obstacles | # Failed Three Obstacles | # Failed Four Obstacles | # Failed Five+ Obstacles |
|---|---|---|---|---|---|---|
| M13-17 | 4 | 1 | 1 | 3 | 1 | 1 |
| F13-17 | 0 | 0 | 0 | 1 | 0 | 1 |
| M18-24 | 28 | 4 | 3 | 0 | 1 | 0 |
| F18-24 | 2 | 0 | 1 | 1 | 3 | 3 |
| M25-29 | 30 | 8 | 4 | 5 | 2 | 1 |
| F25-29 | 1 | 1 | 5 | 5 | 3 | 3 |
| M30-34 | 29 | 10 | 4 | 2 | 3 | 3 |
| F30-34 | 1 | 5 | 3 | 6 | 4 | 6 |
| M35-39 | 27 | 6 | 2 | 6 | 6 | 4 |
| F35-39 | 5 | 4 | 1 | 6 | 2 | 5 |
| M40-44 | 27 | 14 | 3 | 1 | 5 | 2 |
| F40-44 | 3 | 1 | 2 | 4 | 3 | 3 |
| M45-49 | 18 | 5 | 7 | 2 | 5 | 1 |
| F45-59 | 0 | 4 | 2 | 2 | 1 | 4 |
| M50+ | 13 | 6 | 0 | 6 | 2 | 6 |
| F50+ | 0 | 2 | 1 | 1 | 1 | 2 |
2014 OCRWC Platinum Rig Analysis
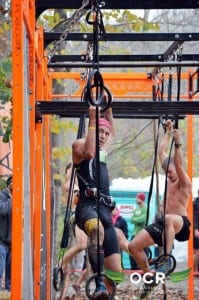 Platinum Rig trivia – this was not in the original course design for the OCRWC. It was added in the last month before the race!
The Platinum Rig is a device that consists of several rings, nunchucks, bars, and poles, which you have to traverse across. This was by far the most devastating obstacle on the course.
Most competitors in the US have not come across obstacles like this while international racers seemed to fare a bit better. The Platinum Rig was open for trial runs on Friday before the race – however, the very last section proved to be so difficult it was modified overnight to make it slightly easier. Then, after Saturday's carnage, multiple sections were amended prior to Sunday's team competition. The Platinum Rig has been announced to return for the 2015 course, with not one, but two separate rigs. The exact configuration won't be known until race day.
Platinum Rig Completion Rate by Country
This table looks at the success rate on the Platinum Rig in 2014, broken down by country
| Country | # of Athletes who passed | % of Athletes who passed | # of Athletes who failed | % of Athletes who failed |
|---|---|---|---|---|
| South Africa | 7 | 100% | 0 | 0% |
| Unknown | 5 | 83.33% | 1 | 16.67% |
| Sweden | 11 | 64.71% | 6 | 35.29% |
| Australia | 7 | 63.64% | 4 | 36.36% |
| Canada | 16 | 57.14% | 12 | 42.86% |
| United States | 253 | 55.12% | 206 | 44.88% |
| The Netherlands | 9 | 52.94% | 8 | 47.06% |
| United Kingdom | 9 | 40.91% | 13 | 59.09% |
| Belgium | 1 | 33.33% | 2 | 66.67% |
| Germany | 0 | 0% | 2 | 100% |
| Mexico | 0 | 0% | 1 | 100% |
Platinum Rig Completion Rate by Division
This table dives into more and more granularity. It starts with overall stats, then male vs. female, and then elite v age group vs. journeyman, and then breaking those down by gender
| Category | # of Athletes who passed | % of Athletes who passed | # of Athletes who failed | % of Athletes who failed |
|---|---|---|---|---|
| Overall | 321 | 56.02% | 252 | 43.98% |
| Male | 281 | 67.06% | 138 | 32.94% |
| Female | 40 | 25.97% | 114 | 74.03% |
| Elite | 56 | 57.14% | 42 | 42.86% |
| Age-Groupers | 243 | 55.73% | 193 | 44.27% |
| Journeyman | 22 | 56.41% | 17 | 43.59% |
| Male Elite | 46 | 67.65% | 22 | 32.35% |
| Female Elite | 10 | 33.33% | 20 | 66.67% |
| Male Age-Grouper | 217 | 67.39% | 105 | 32.61% |
| Female Age-Grouper | 26 | 22.81% | 88 | 77.19% |
| Male Journeyman | 18 | 62.07% | 11 | 37.93% |
| Female Journeyman | 4 | 40.00% | 6 | 60.00% |
Platinum Rig Completion Rate by Age-Group Category
This dives into each age group category, after the overview from above.
| Age Group Division | # of Athletes who passed | % of Athletes who passed | # of Athletes who failed | % of Athletes who failed |
|---|---|---|---|---|
| M13-17 | 5 | 45.45% | 6 | 54.55% |
| F13-17 | 1 | 50.00% | 1 | 50.00% |
| M18-24 | 30 | 83.33% | 6 | 16.67% |
| F18-24 | 2 | 20.00% | 8 | 80.00% |
| M25-29 | 36 | 72.00% | 14 | 28.00% |
| F25-29 | 4 | 22.22% | 14 | 77.78% |
| M30-34 | 37 | 72.55% | 14 | 27.45% |
| F30-34 | 2 | 8.00% | 23 | 92.00% |
| M35-39 | 35 | 68.63% | 16 | 31.37% |
| F35-39 | 7 | 30.43% | 16 | 69.57% |
| M40-44 | 37 | 71.15% | 15 | 28.85% |
| F40-44 | 4 | 25.00% | 12 | 75.00% |
| M45-49 | 22 | 57.89% | 16 | 42.11% |
| F45-59 | 5 | 38.46% | 8 | 61.54% |
| M50+ | 15 | 45.45% | 18 | 54.55% |
| F50+ | 1 | 14.29% | 6 | 87.51% |
Platinum Rig Failure Only?
Of those people who failed platinum rig…..let's take a look at who just failed that obstacle, or then went on to fail others.
| Category | # of Athletes who Only Failed Platinum Rig | % of Athletes who Only Failed Platinum Rig | # of Athletes who Failed Platinum Rig and Others | % of Athletes who Failed Platinum Rig and Others |
|---|---|---|---|---|
| Overall | 61 | 24.21% | 191 | 75.79% |
| Male | 39 | 28.26% | 99 | 71.74% |
| Female | 22 | 19.30% | 92 | 80.70% |
| Elite | 19 | 45.24% | 23 | 54.76% |
| Age-Groupers | 40 | 20.73% | 153 | 79.27% |
| Journeyman | 2 | 11.76% | 15 | 88.24% |
| Male Elite | 10 | 45.45% | 12 | 54.55% |
| Female Elite | 9 | 45% | 11 | 55% |
| Male Age-Grouper | 29 | 27.62% | 76 | 72.38% |
| Female Age-Grouper | 11 | 12.50% | 77 | 87.50% |
| Male Journeyman | 0 | 0% | 11 | 100% |
| Female Journeyman | 2 | 33.33% | 4 | 66.67% |
2014 OCRWC Ring My Bell Analysis
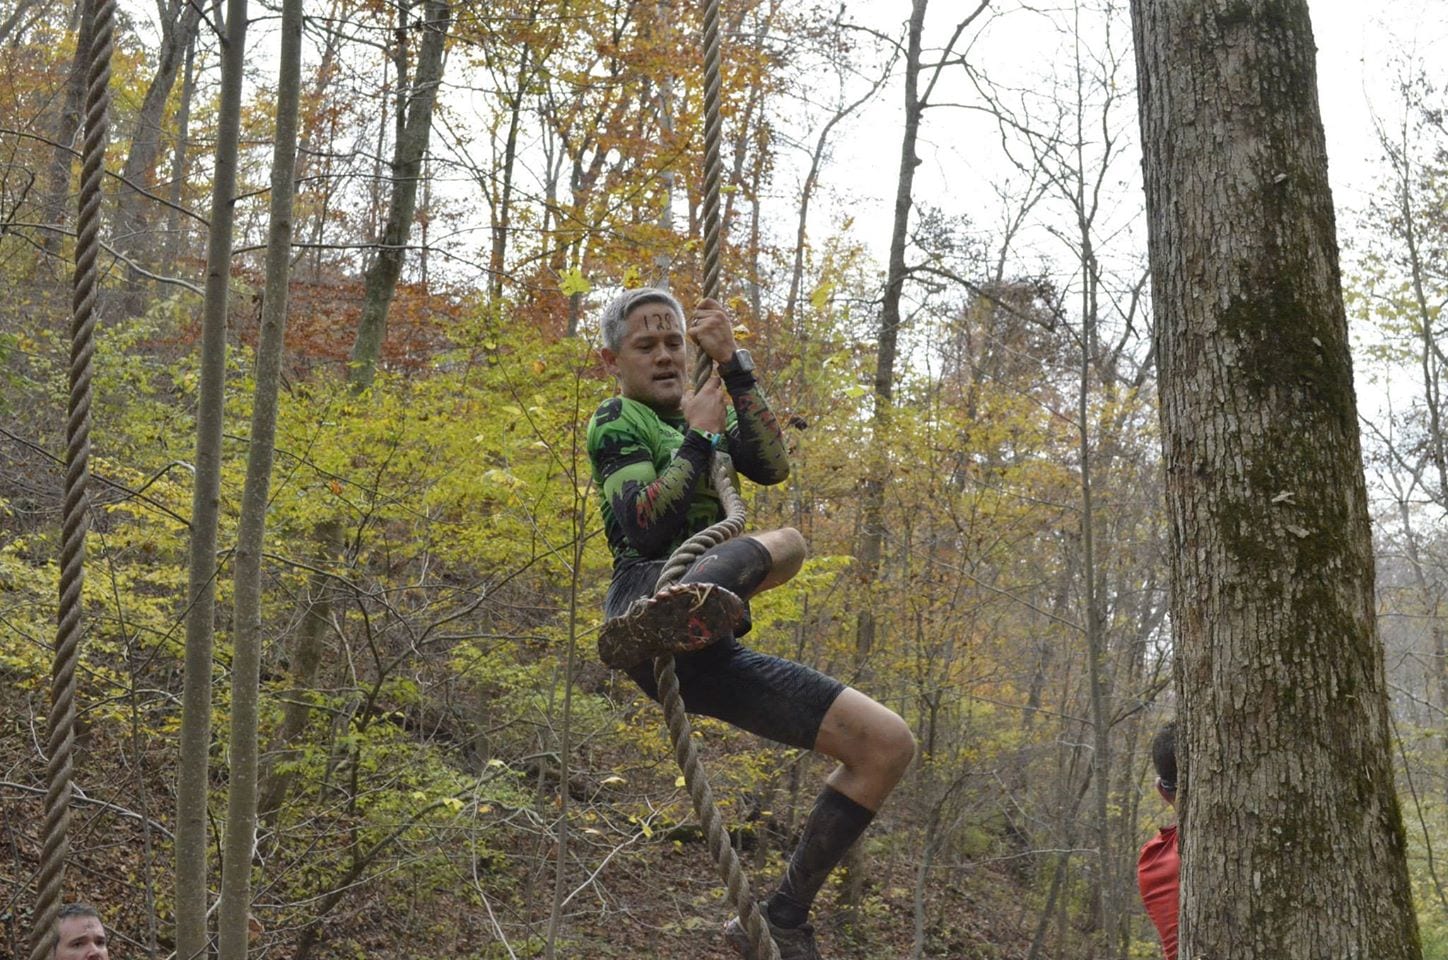 Ring My Bell was a knotless rope climb located in the woods about halfway through the course. It was after Platinum Rig, so if people had worn themselves down making multiple attempts on the Rig, they had no energy left to do the climb. Ring My Bell ended up having the 2nd highest failure rate of any obstacle on the course.
Ring My Bell Completion Rate by Country
This table looks at the success rate on the Ring My Bell in 2014, broken down by country
| Country | # of Athletes who passed | % of Athletes who passed | # of Athletes who failed | % of Athletes who failed |
|---|---|---|---|---|
| South Africa | 7 | 100% | 0 | 0.00% |
| Unknown | 5 | 83.33% | 1 | 16.67% |
| Sweden | 16 | 94.12% | 1 | 5.88% |
| Australia | 10 | 90.91% | 1 | 9.09% |
| Canada | 25 | 89.29% | 3 | 10.71% |
| United States | 311 | 67.76% | 148 | 32.24% |
| The Netherlands | 14 | 82.35% | 3 | 17.65% |
| United Kingdom | 15 | 68.18% | 7 | 31.82% |
| Belgium | 1 | 33.33% | 2 | 66.67% |
| Germany | 2 | 100% | 0 | 0.00% |
| Mexico | 1 | 100% | 0 | 0% |
Ring My Bell Completion Rate by Division
This table dives into more and more granularity. It starts with overall stats, then male vs. female, and then elite v age group vs. journeyman, breaking those down by gender
| Category | # of Athletes who passed | % of Athletes who passed | # of Athletes who failed | % of Athletes who failed |
|---|---|---|---|---|
| Overall | 407 | 71.03% | 166 | 28.97% |
| Male | 324 | 77.33% | 95 | 22.67% |
| Female | 83 | 53.90% | 71 | 46.10% |
| Elite | 87 | 88.78% | 11 | 11.22% |
| Age-Groupers | 301 | 69.04% | 135 | 30.96% |
| Journeyman | 19 | 48.72% | 20 | 51.28% |
| Male Elite | 62 | 91.18% | 6 | 8.82% |
| Female Elite | 25 | 83.33% | 5 | 16.67% |
| Male Age-Grouper | 246 | 76.40% | 76 | 23.60% |
| Female Age-Grouper | 55 | 48.25% | 59 | 51.75% |
| Male Journeyman | 16 | 55.17% | 13 | 44.83% |
| Female Journeyman | 3 | 30.00% | 7 | 70.00% |
Ring My Bell Completion Rate by Age-Group Category
This dives into each age group category, after the overview from above.
| Age Group Division | # of Athletes who passed | % of Athletes who passed | # of Athletes who failed | % of Athletes who failed |
|---|---|---|---|---|
| M13-17 | 7 | 63.64% | 4 | 36.36% |
| F13-17 | 1 | 50.00% | 1 | 50.00% |
| M18-24 | 33 | 91.67% | 3 | 8.33% |
| F18-24 | 4 | 40.00% | 6 | 60.00% |
| M25-29 | 43 | 86.00% | 7 | 14.00% |
| F25-29 | 9 | 50.00% | 9 | 50.00% |
| M30-34 | 39 | 76.47% | 12 | 23.53% |
| F30-34 | 13 | 52.00% | 12 | 48.00% |
| M35-39 | 35 | 68.63% | 16 | 31.37% |
| F35-39 | 10 | 43.48% | 13 | 56.52% |
| M40-44 | 40 | 76.92% | 12 | 23.08% |
| F40-44 | 9 | 56.25% | 7 | 43.75% |
| M45-49 | 26 | 68.42% | 12 | 31.58% |
| F45-59 | 7 | 53.85% | 6 | 46.15% |
| M50+ | 23 | 69.70% | 10 | 30.30% |
| F50+ | 2 | 28.57% | 5 | 71.43% |
2014 OCRWC Tip of the Spear Analysis
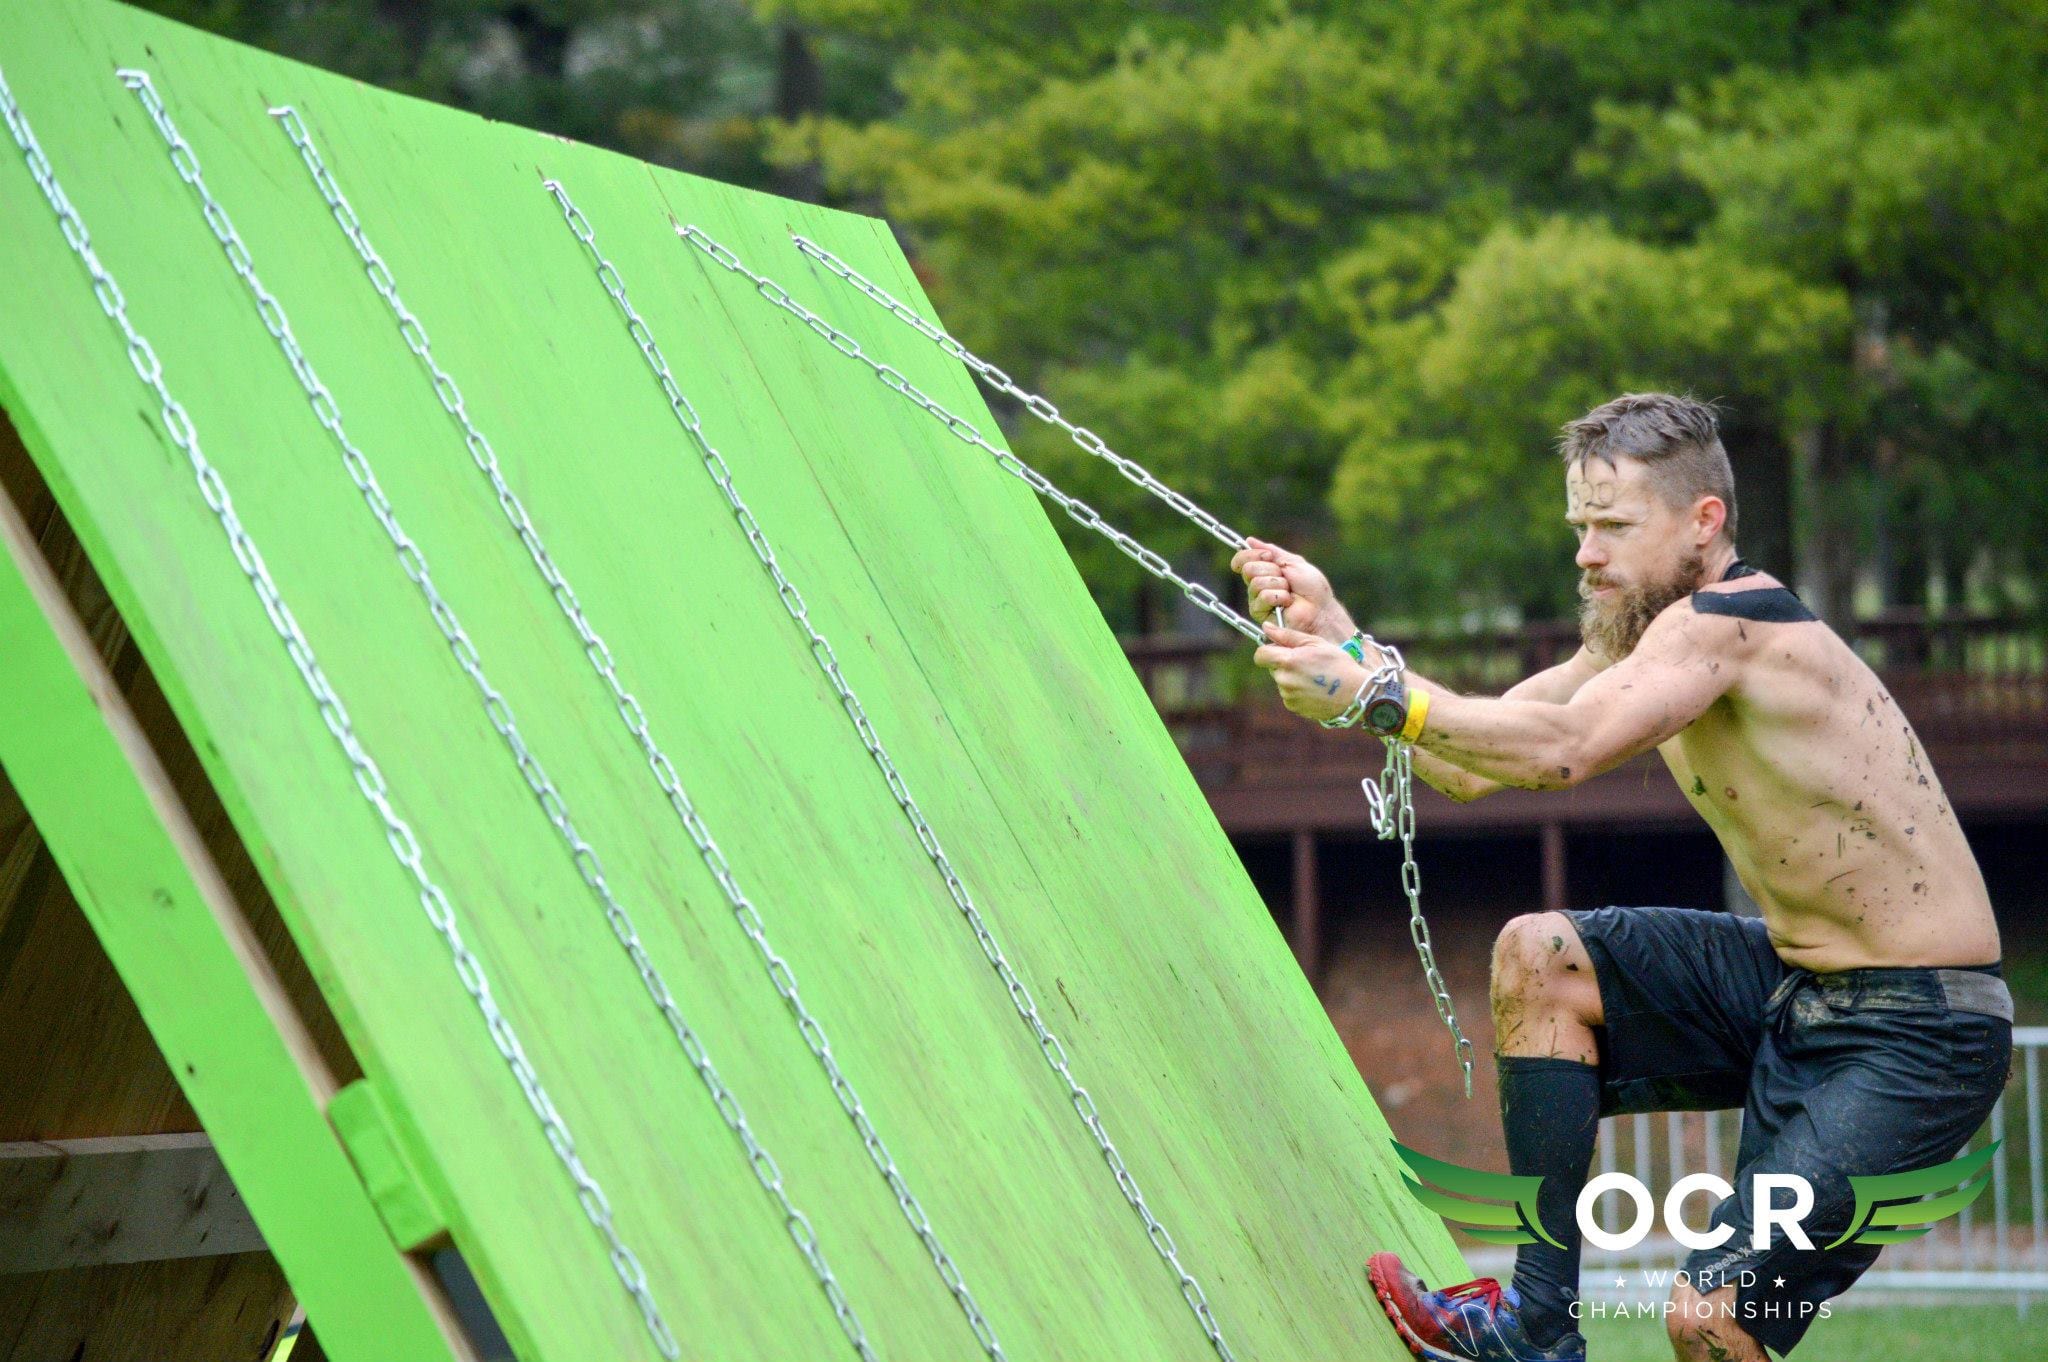 Tip of the Spear was an obstacle courtesy of Battlefrog Obstacle Race Series. Competitors had to work their way along a slanted wall using chains for grips, followed by a 2nd slanted wall using hand-grips on the wall. Historically this obstacle had ropes. However, the chains provided an extra challenge for tired hands at the end of the race.
Tip of the Spear Completion Rate by Country
This table looks at the success rate on the Tip of the Spear in 2014, broken down by country
| Country | # of Athletes who passed | % of Athletes who passed | # of Athletes who failed | % of Athletes who failed |
|---|---|---|---|---|
| South Africa | 7 | 100% | 0 | 0% |
| Unknown | 5 | 83.33% | 1 | 16.67% |
| Sweden | 16 | 94.12% | 1 | 5.88% |
| Australia | 8 | 72.73% | 3 | 27.27% |
| Canada | 14 | 77.78% | 4 | 22.22% |
| United States | 335 | 72.83% | 125 | 27.17% |
| The Netherlands | 12 | 70.59% | 5 | 29.41% |
| United Kingdom | 13 | 59.09% | 9 | 40.91% |
| Belgium | 1 | 33.33% | 2 | 66.67% |
| Germany | 1 | 50.00% | 1 | 50.00% |
| Mexico | 1 | 100% | 0 | 0% |
Tip of the Spear Completion Rate by Division
This table dives into more and more granularity. It starts with overall stats, then male vs. female, and then elite v age group vs. journeyman, breaking those down by gender
| Category | # of Athletes who passed | % of Athletes who passed | # of Athletes who failed | % of Athletes who failed |
|---|---|---|---|---|
| Overall | 423 | 73.69% | 151 | 26.31% |
| Male | 348 | 82.86% | 72 | 17.14% |
| Female | 75 | 48.70% | 79 | 51.30% |
| Elite | 80 | 81.63% | 18 | 18.37% |
| Age-Groupers | 313 | 71.79% | 123 | 28.21% |
| Journeyman | 30 | 75.00% | 10 | 25.00% |
| Male Elite | 61 | 89.71% | 7 | 10.29% |
| Female Elite | 19 | 63.33% | 11 | 36.67% |
| Male Age-Grouper | 265 | 82.30% | 57 | 17.70% |
| Female Age-Grouper | 48 | 42.11% | 66 | 57.89% |
| Male Journeyman | 22 | 73.33% | 8 | 26.67% |
| Female Journeyman | 8 | 80.00% | 2 | 20.00% |
Tip of the Spear Completion Rate by Age-Group Category
This dives into each age group category, after the overview from above.
| Age Group Division | # of Athletes who passed | % of Athletes who passed | # of Athletes who failed | % of Athletes who failed |
|---|---|---|---|---|
| M13-17 | 7 | 63.64% | 4 | 36.36% |
| F13-17 | 0 | 0% | 2 | 100% |
| M18-24 | 35 | 97.22% | 1 | 2.78% |
| F18-24 | 4 | 40.00% | 6 | 60.00% |
| M25-29 | 44 | 88.00% | 6 | 12.00% |
| F25-29 | 7 | 38.39% | 11 | 61.11% |
| M30-34 | 41 | 80.39% | 10 | 19.61% |
| F30-34 | 9 | 36.00% | 16 | 64.00% |
| M35-39 | 35 | 68.63% | 16 | 31.37% |
| F35-39 | 12 | 52.17% | 11 | 47.83% |
| M40-44 | 47 | 90.38% | 5 | 9.62% |
| F40-44 | 6 | 37.50% | 10 | 62.50% |
| M45-49 | 32 | 84.21% | 6 | 15.79% |
| F45-59 | 6 | 46.15% | 7 | 53.85% |
| M50+ | 24 | 72.73% | 9 | 27.27% |
| F50+ | 4 | 57.14% | 3 | 42.86% |
2014 OCRWC Weaver Analysis
 The Weaver was a unique obstacle permanently located on the Mud, Guts, and Glory course. Racers had to work their way over and under logs that went up an incline, and then back down the other side.
Weaver Completion Rate by Country
This table looks at the success rate on the Weaver in 2014, broken down by country
| Country | # of Athletes who passed | % of Athletes who passed | # of Athletes who failed | % of Athletes who failed |
|---|---|---|---|---|
| South Africa | 7 | 100% | 0 | 0% |
| Unknown | 4 | 66.67% | 2 | 33.33% |
| Sweden | 16 | 94.12% | 1 | 5.88% |
| Australia | 10 | 90.91% | 1 | 9.09% |
| Canada | 22 | 78.57% | 6 | 21.43% |
| United States | 372 | 80.87% | 88 | 19.13% |
| The Netherlands | 15 | 88.24% | 2 | 11.76% |
| United Kingdom | 13 | 59.09% | 9 | 40.91% |
| Belgium | 2 | 66.67% | 1 | 33.33% |
| Germany | 1 | 50.00% | 1 | 50.00% |
| Mexico | 0 | 0% | 1 | 100% |
Weaver Completion Rate by Division
This table dives into more and more granularity. It starts with overall stats, and then male vs. female, then elite v age group vs. journeyman, then and breaking those down by gender
| Category | # of Athletes who passed | % of Athletes who passed | # of Athletes who failed | % of Athletes who failed |
|---|---|---|---|---|
| Overall | 462 | 80.49% | 112 | 19.51% |
| Male | 353 | 84.25% | 66 | 15.75% |
| Female | 109 | 70.32% | 46 | 29.68% |
| Elite | 91 | 92.86% | 7 | 7.14% |
| Age-Groupers | 340 | 77.98% | 96 | 22.02% |
| Journeyman | 31 | 77.50% | 9 | 22.50% |
| Male Elite | 63 | 92.65% | 5 | 7.35% |
| Female Elite | 28 | 93.33% | 2 | 6.67% |
| Male Age-Grouper | 267 | 82.92% | 55 | 17.08% |
| Female Age-Grouper | 73 | 64.04% | 41 | 35.96% |
| Male Journeyman | 23 | 79.31% | 6 | 20.69% |
| Female Journeyman | 8 | 72.73% | 3 | 27.27% |
Weaver Completion Rate by Age-Group Category
This chart dives into each age group category, after the overview from above.
| Age Group Division | # of Athletes who passed | % of Athletes who passed | # of Athletes who failed | % of Athletes who failed |
|---|---|---|---|---|
| M13-17 | 8 | 72.73% | 3 | 27.27% |
| F13-17 | 0 | 0% | 2 | 100% |
| M18-24 | 34 | 94.44% | 2 | 5.56% |
| F18-24 | 2 | 22.22% | 7 | 77.78% |
| M25-29 | 43 | 86.00% | 7 | 14.00% |
| F25-29 | 12 | 66.67% | 6 | 33.33% |
| M30-34 | 45 | 88.24% | 6 | 11.76% |
| F30-34 | 15 | 60.00% | 10 | 40.00% |
| M35-39 | 39 | 76.57% | 12 | 23.53% |
| F35-39 | 18 | 78.26% | 5 | 21.74% |
| M40-44 | 41 | 78.85% | 11 | 21.15% |
| F40-44 | 14 | 87.50% | 2 | 12.50% |
| M45-49 | 32 | 84.21% | 6 | 15.79% |
| F45-59 | 6 | 46.15% | 7 | 53.85% |
| M50+ | 25 | 75.76% | 8 | 24.24% |
| F50+ | 5 | 71.43% | 2 | 28.57% |
Weaver Completion Rate by State
Since Weaver is a unique obstacle to Mud, guts and glory….did those people in Ohio, who have likely visited the course before, perform better? We'll compare those age-groupers from Ohio vs. age groupers from elsewhere in the USA.
| State | # of Athletes who passed | % of Athletes who passed | # of Athletes who failed | % of Athletes who failed |
|---|---|---|---|---|
| Ohio | 87 | 79.82% | 22 | 20.18% |
| All other US States | 285 | 81.20% | 66 | 18.80% |
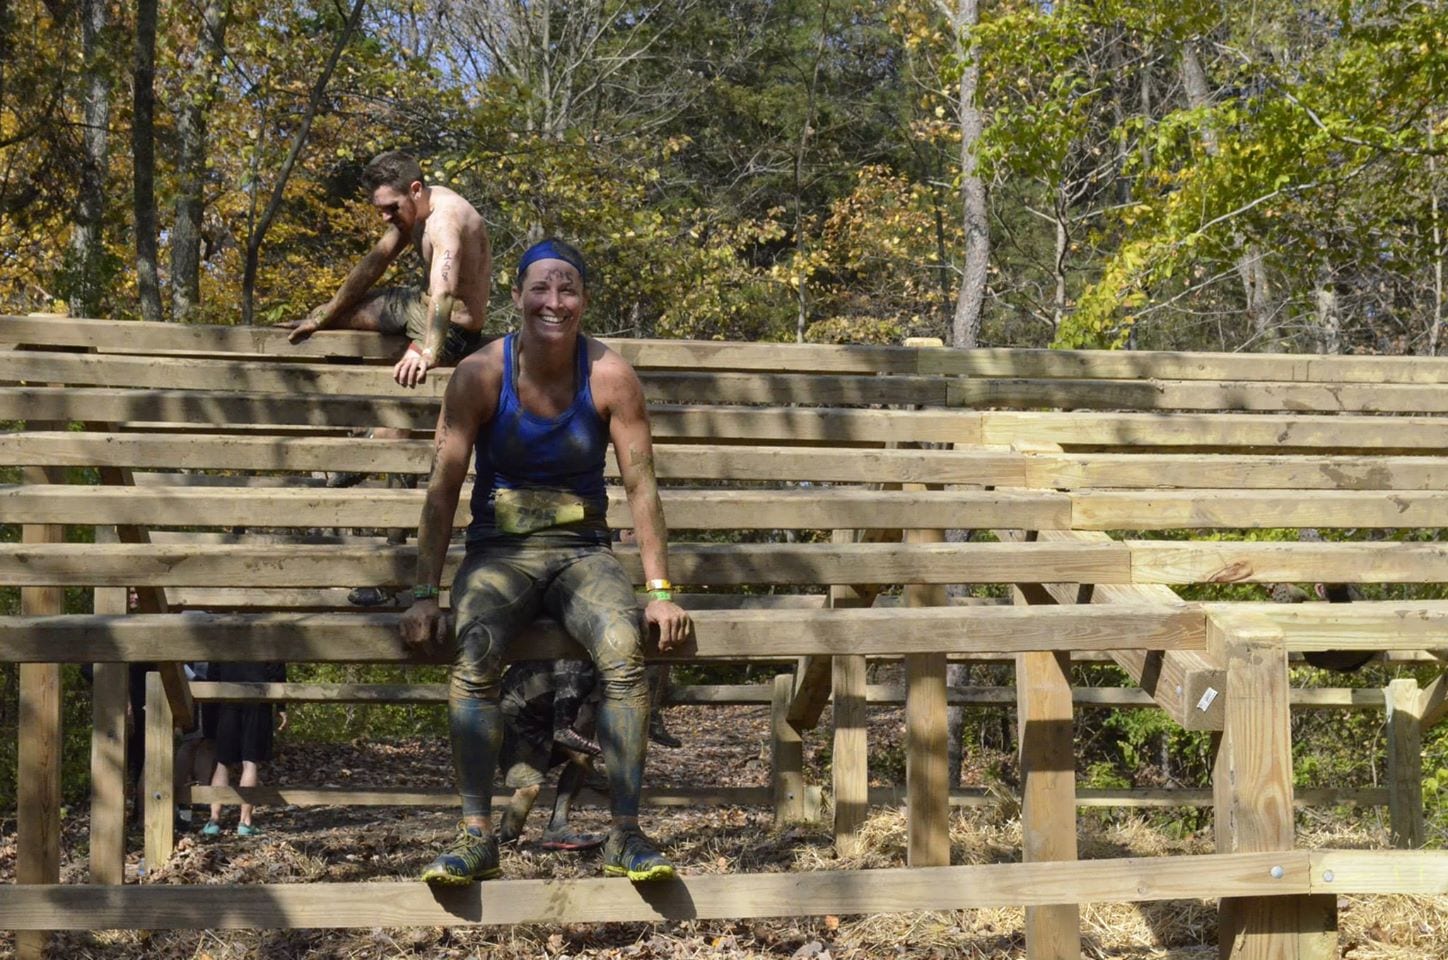
2014 OCRWC Monkey Business Analysis
 Monkey Business is another obstacle that permanently lives at MG&G. This is a massive monkey bar structure, that works its way down an incline, and then back up the other side.
Monkey Business Completion Rate by Country
This table looks at the success rate on the Monkey Business in 2014, broken down by country
| Country | # of Athletes who passed | % of Athletes who passed | # of Athletes who failed | % of Athletes who failed |
|---|---|---|---|---|
| South Africa | 7 | 100% | 0 | 0% |
| Unknown | 5 | 83.33% | 1 | 16.67% |
| Sweden | 17 | 100% | 0 | 0% |
| Australia | 11 | 100% | 0 | 0% |
| Canada | 25 | 89.29% | 3 | 10.71% |
| United States | 406 | 88.45% | 53 | 11.55% |
| The Netherlands | 16 | 94.12% | 1 | 5.88% |
| United Kingdom | 18 | 81.82% | 4 | 18.18% |
| Belgium | 2 | 66.67% | 1 | 33.33% |
| Germany | 1 | 50.00% | 1 | 50.00% |
| Mexico | 1 | 100% | 0 | 0% |
Monkey Business Completion Rate by Division
This table dives into more and more granularity. It starts with overall stats, then male vs. female, and then elite v age group vs. journeyman, and then breaking those down by gender
| Category | # of Athletes who passed | % of Athletes who passed | # of Athletes who failed | % of Athletes who failed |
|---|---|---|---|---|
| Overall | 509 | 88.83% | 64 | 11.17% |
| Male | 378 | 90.21% | 41 | 9.79% |
| Female | 131 | 85.06% | 23 | 14.94% |
| Elite | 97 | 98.98% | 1 | 1.02% |
| Age-Groupers | 387 | 88.76% | 49 | 11.24% |
| Journeyman | 25 | 64.10% | 14 | 35.90% |
| Male Elite | 68 | 100% | 0 | 0% |
| Female Elite | 29 | 96.67% | 1 | 3.33% |
| Male Age-Grouper | 291 | 90.37% | 31 | 9.63% |
| Female Age-Grouper | 96 | 84.21% | 18 | 15.79% |
| Male Journeyman | 19 | 65.62% | 10 | 34.48% |
| Female Journeyman | 6 | 60.00% | 4 | 40.00% |
Monkey Business Completion Rate by Age-Group Category
This dives into each age group category, after the overview from above.
| Age Group Division | # of Athletes who passed | % of Athletes who passed | # of Athletes who failed | % of Athletes who failed |
|---|---|---|---|---|
| M13-17 | 8 | 72.73% | 3 | 27.27% |
| F13-17 | 1 | 50.00% | 1 | 50.00% |
| M18-24 | 35 | 97.22% | 1 | 2.78% |
| F18-24 | 8 | 80.00% | 2 | 20.00% |
| M25-29 | 49 | 98.00% | 1 | 2.00% |
| F25-29 | 16 | 88.89% | 2 | 11.11% |
| M30-34 | 46 | 90.20% | 5 | 9.80% |
| F30-34 | 22 | 88.00% | 3 | 12.00% |
| M35-39 | 46 | 90.20% | 5 | 9.80% |
| F35-39 | 19 | 82.61% | 4 | 17.39% |
| M40-44 | 48 | 92.31% | 4 | 7.69% |
| F40-44 | 13 | 81.25% | 3 | 18.75% |
| M45-49 | 34 | 89.47% | 4 | 10.53% |
| F45-59 | 12 | 92.31% | 1 | 7.69% |
| M50+ | 25 | 75.76% | 8 | 24.24% |
| F50+ | 5 | 71.43% | 2 | 28.57% |
2014 OCRWC Interesting Fun Facts
– 40 People failed Ring My Bell, but completed platinum rig.
– 30 people failed tip of my spear, but completed platinum rig.
– 15 people failed monkey business, but completed platinum rig.
2014 OCRWC Obstacle Analysis Conclusion
There is a constant debate on how hard an obstacle course could be. Make it too easy, and it's not a “championship level” event. Make it too hard, and you'll get into the unsolvable debate on what an acceptable level of completion should be. OCRWC seemed to tread that line last year. Yes, they had a difficult, rarely seen (at the time) obstacle in Platinum Rig. However, based on it's placement on the course, a simple rope climb (Ring My Bell) proved to be almost as difficult to complete.
I think it is fair to say that females were at a disadvantage on this course. Only 13% of the women who competed were able to do so without obstacle failure, compared to 55% of the men. (Looking at the elite women only, still only 30% of the elite women did so). In addition, while we have a limited data set, it appears the European competitors have an advantage on an obstacle heavy course like this. However, that tends to be the trend with European races in general, so it's not too surprising.
The real question remains: will the results from last year shape the obstacles included for 2015? Do the organizers think a 40% obstacle rate completion is their target? What do you say the ‘ideal' completion rate should be?


Leave A Comment