
I recently spent a lot of time on airplanes, so I took all the results and data from this year’s Obstacle Course Racing World Championships and calculated all the statistics for pass/fail rates. I’m going to go out on a limb and state that one of the obstacles this year has created an industry first. But first, the statistics. The numbers of competitors including pass/fail information were taken directly from the timing data gathered by Chosen USA, this year’s official timing company.
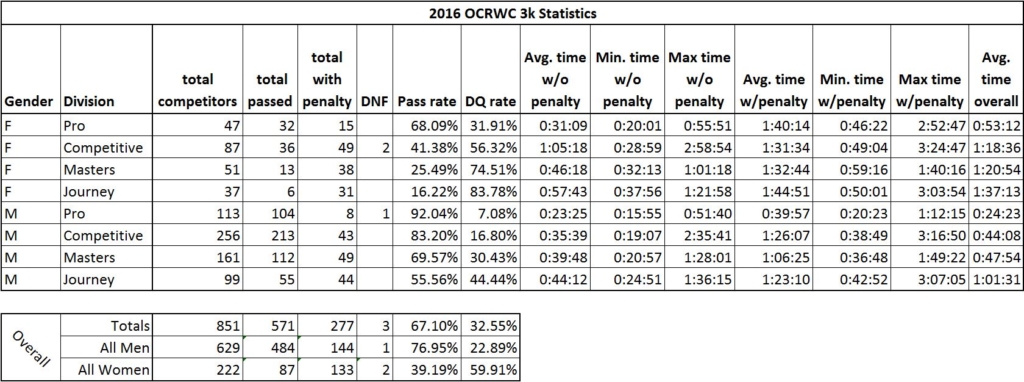
In the following chart, you will see the individual statistics for the 3k short course that was held on Friday. Starting from the left, the first two columns show the divisions. Then you find the total number of participants in each division, the total number of people that completed all the obstacles, the total number of participants that did not complete all the obstacles and the number of participants that ‘Did Not Finish’. Next you see the percentage of participants that either completed all the obstacles or were disqualified by not completing. The columns showing the average, minimum and maximum times with or without penalty can be used to see where you as a participant fell within the divisions. I suggest you use this to help you determine if you were in the correct division or not. The smaller chart at the bottom shows the overall numbers from all divisions.
2016 – 3K OCRWC Statistics
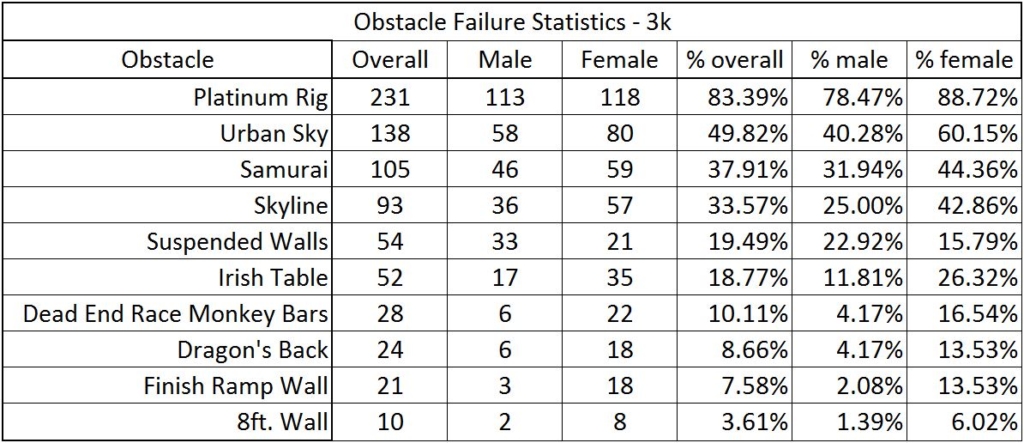
Now for some interesting data. Following is a list of every obstacle that recorded a participant failure with the numbers of participants that failed each obstacle. The overall, male and female percentages are calculated from the total number of participants that failed obstacles. For example, the total number of women that failed the Platinum Rig is 118. This is 88.72% of the 133 women that failed obstacles for the entire event. Obstacles with the highest failure rate are first. In the inaugural OCR World Championships held in 2014, Platinum Rig was new to the industry and proved to be the ‘band-taker’ of the event.
Once again, the Platinum Rig takes the most bands. However, you will see that the numbers of males versus females to fail the obstacle have settled to almost even. Of the 231 total failures, 113 of them were male, and 118 were female. The Rig followed by Urban Sky and Samurai, also by Platinum Rig, then Skyline. The big news of the event and an industry first from the Suspended Walls, provided by The Indian Mud Run. You will see in the data that, for the first time, women had an advantage over men. More men failed this obstacle than women.
I reached out to Hubie Cushman, the designer and fabricator of The Suspended Walls and the Race Director of the Indian Mud Run. Hubie was very excited and shocked to hear the news of the impact his obstacle had at this year’s event. “It just makes me happy to be able to provide something new and challenging to the industry and the OCR community,” said Cushman. I asked him if he any ideas as to why women did better on his obstacle than men. Cushman responded with “I honestly don’t know, but I’m going to put some thought into that. It wasn’t intentional. I was trying to design something that was equally challenging to everyone”.
Probably because men are inherently bigger and heavier the failure rate was higher. With the fact that these traverse walls suspended off the ground creates an entirely different effect caused by gravity. For the larger and heavier athlete, the more the bottom is likely to push out away causing an athlete's center of gravity further from the board. I’m very curious as to what others may think and would ask that you comment on this article with your thoughts on this.
Whatever the reason, this is revolutionary in the industry and what OCR needs more of. The Suspended Walls took an obstacle that most races use in some form on the ground, put a twist on it and created something extraordinary. Innovation like this is greatly appreciated and much needed.
3K OCRWC Failure Rates
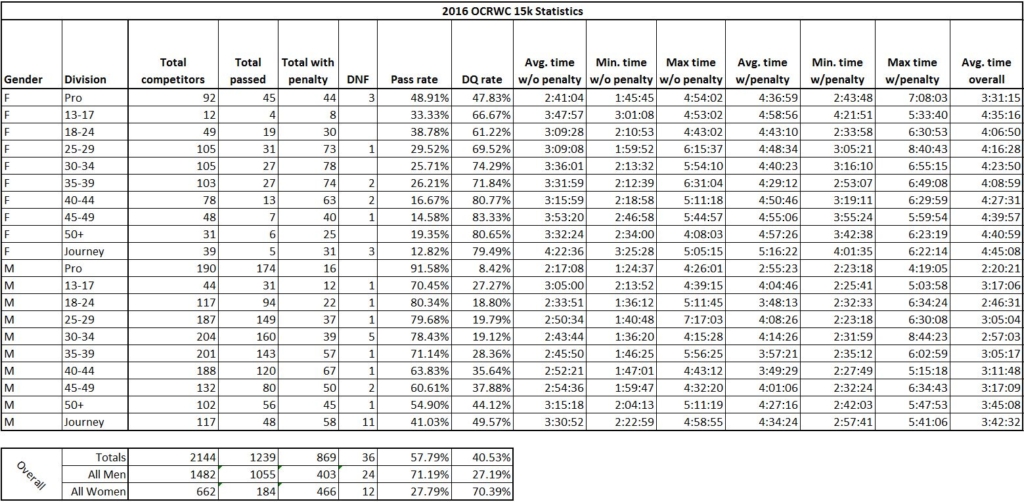
Below are the individual statistics for the 15k Event.
15K OCRWC Statistics
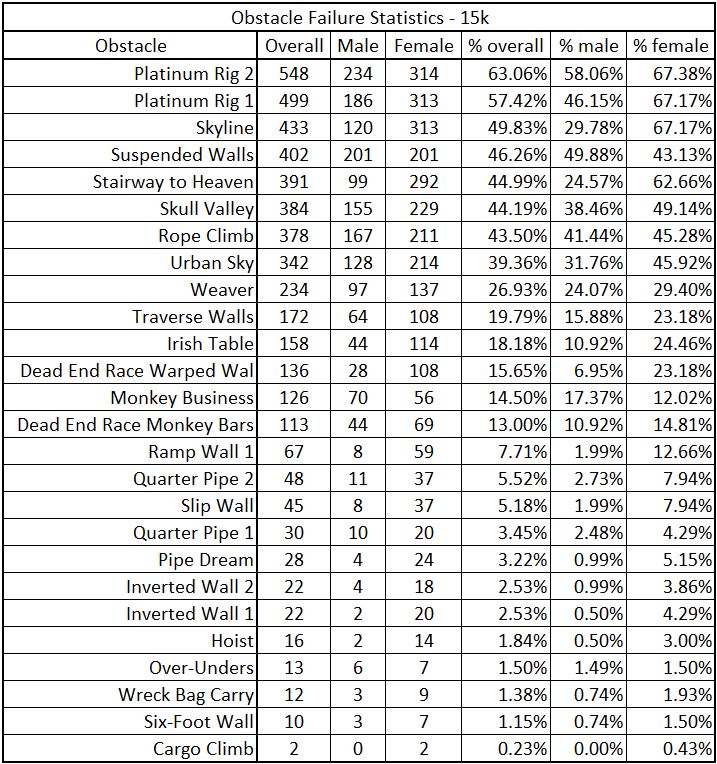
And next is the chart showing the obstacle statistics for the 15k course. Once again, all things Platinum Rig continue to take bands. The obstacle called Platinum Rig 2 was the Rig that was low to the ground. I know you all remember that one. Now, instead of working on your grip strength, you need also to work on core, core, core. Great obstacle by Platinum Rig, with a few modifications that could help increase through-put, I see this obstacle going places. Additionally, you’ll see the incredible impact the Suspended Walls had on the crowd equally challenging to both men and women. Maybe after Friday, some of the guys figured out what to do on this one.
15K OCRWC Failure Rates
Overall, there has been a trend since the inaugural OCRWC event in 2014 that shows a higher pass rate each year. Have the obstacles gotten easier? Or more likely, Does this show progressive improvement in the athletes? The one trend that is beyond dispute is the total number of participants each year continues to rise. This is perfect for both the industry and the community.
Disclaimer: The viewpoints expressed by the authors do not necessarily reflect the opinions, viewpoints and official policies of Mud Run Guide LLC, or their staff. The comments posted on this Website are solely the opinions of the posters.


Thanks for these numbers! I’ve a remark though.
Unless I misunderstand this, 22 out of 222 women failed the Suspended Walls on the 3k course, versus 33 out of 629 men. That’s about 10% of all women vs roughly 5% of all men. While they form a lower percentage of total failures, this merely indicates that, when failing an obstacle, women were less likely to fail the suspended walls than men. Overall they still have a higher failure rate than men though.
Elte – yes, you misunderstand. The percentages are calculated from the total number of men or women that failed. 21 out of 133 and 33 out of 144.
You’re absolutely right Elte. Here’s the reasoning:
MORE IMPORTANTLY, I think that this “revolutionary” gender split on the Suspended Walls is overemphasized in the article because of one important data point which was overlooked. The raw number of men vs. women failing the walls was about the same in the 15K and more men failed in the 3K, yes. But brought back to a PERCENTAGE of the number of participants of each gender tells a completely different story.
My math may be off, but hopefully I get this correctly.
Total number of participants for the 3K was
MEN 629 – WOMEN 222
Fails for the walls for the 3K was
MEN 33 – WOMEN 21
Which as a % of total participants was
MEN 5% – WOMEN 9.5%
So the failure rate is still higher among women for that obstacle.
For the 15K, we had 1482 men and 662 women, and when you take the failure numbers at the walls for men and women (201 each), that gives a failure rate of 13.5% for men, 30% for women. Again, failure rate is much higher for women than men on this obstacle.
With a failure rate about double for women vs. men, I don’t think we can say that “women had an advantage over men. More men failed this obstacle than women.” or that “because men are inherently bigger and heavier the failure rate was higher”.
Of course, what is true is that the gap is definitely smaller between men and women at this obstacle compared to others. A few examples:
PLATINUM RIG (3K)
MEN 18% fail – WOMEN 53% fail
PLATINUM RIG 1 (15K)
MEN 12.5% fail – WOMEN 47% fail
PLATINUM RIG 2 (15K)
MEN 16% fail – WOMEN 47% fail
Interestingly, it doesn’t seem like there was a huge difference in failure rates for the mini Rig compared to the normal one in the 15K.
But I would argue data is skewed somewhat because when you fail that first obstacle, you can either
a) Decide it’s not really worth it to do multiple tries at further obstacles and decide to fail them quicker than you would have (reducing success rate)
b) Take your time, not run as fast, enjoy things and get to the obstacles in a fresher state (improving success rate)
Not sure which one is more applicable but data will be skewed.
Kevin is calculating percentages as a proportion of people who failed. That’s interesting but in my opinion not the best way to judge which obstacle was more difficult for whom. % of failures vs. number of participants is what’s more telling.
Thanks Sebastien for making my point more clearly. Kevin, what we’re trying to say is that those 133 and 144 are total number of obstacle failures, not total number of participants. To state that women have an advantage over men on a certain obstacle I would say that a lower percentage of total women would need to fail it, which doesn’t appear to be the case here.
The percentages (category obstacle failure / category total failures) for each category can tell us something about the relative obstacle difficulty, but only within the category. Comparing the absolute number of men and women that failed an obstacle is however meaningless without taking their total number of participants into account. For example, let’s say that only 30 women ran the course, and all 30 of them failed obstacle X. If 600 men ran the course and 60 of them failed that same obstacle, the number of men failing it would be twice as high as the number of women – but I hope you agree with me that obstacle X was still much harder for women than it was for men.
@Sebastien, I think to validate hypothesis (a) or (b) we need statistics for consecutive obstacle failures, i.e. P(obstacle i failure | any obstacle i-1 failure). That would actually be very interesting to know, any chance we can have a crack at these numbers ourselves :D?
Nice write up Kevin!!
The sport is definitely growing!! People who brushed off OCR 2-3 years ago are now running OCR events.
Are the obstacles getting easier?? I don’t care because the community is growing and my Dad is now training to run his first OCR race at 65yrs. <– Thats what matters!!
I firmly believe that this sport could save our populous.
Hanging walls were horrible for a 16 stone ( 105kg) male. Must have pushed them 3foot sideways with my weight and felt I was doing them as a underhang traverse. They hardly moved as my wife ( 55kg) went across them
Thanks for the great article Kevin.
This is great info, thank you for sharing it. I dont see dragons back in the 15K list, am i missing it?
Erin, It is missing. I didn’t even notice that before I posted this. I have gone back to the timing company to see if I can get that information.
It could be fun to get some nations statistics
Fastest country, Fails pr country and so on 🙂
I agree but the nationality of each participant was not recorded in the timing data